
- Home >
- Stock Videos >
- Financial Data Analysis with Global Chart and Timeline Elements
Financial Data Analysis with Global Chart and Timeline Elements Video
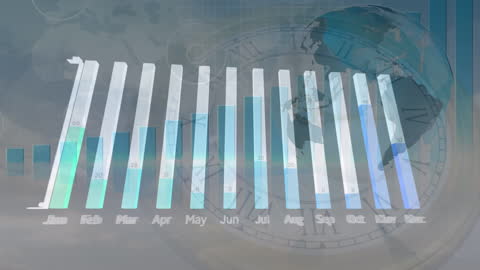
Illustration depicting financial data and business statistics analysis projected over a globe, with months displayed in bar chart form. Represents global economic trends, data processing and technology in finance. Uses could include presentations on global market analysis, financial planning software ads, or blog articles about economic forecasting.
Powered by 


downloads
Tags:
More
Credit Photo
If you would like to credit the Photo, here are some ways you can do so
Text Link
video Link
<span class="text-link">
<span>
<a target="_blank" href=https://pikwizard.com/video/financial-data-analysis-with-global-chart-and-timeline-elements/cf14e37980cdc94411e74e90cad9c46f/>PikWizard</a>
</span>
</span>
<span class="image-link">
<span
style="margin: 0 0 20px 0; display: inline-block; vertical-align: middle; width: 100%;"
>
<a
target="_blank"
href="https://pikwizard.com/video/financial-data-analysis-with-global-chart-and-timeline-elements/cf14e37980cdc94411e74e90cad9c46f/"
style="text-decoration: none; font-size: 10px; margin: 0;"
>
<video controls style="width: 100%; margin: 0;">
<source src="https://player.vimeo.com/progressive_redirect/playback/736855633/rendition/240p/file.mp4?loc=external&oauth2_token_id=1223210874&signature=acdd6aa25e2a20e20ff1c7e5a3aa134d62d9e0424837543b87842fbf6003ce6b" type="video/mp4"
poster="https://pikwizard.com/pw/medium/cf14e37980cdc94411e74e90cad9c46f.jpg"/>
Your browser does not support the video tag.
</video>
<p style="font-size: 12px; margin: 0;">PikWizard</p>
</a>
</span>
</span>
Free (free of charge)
Free for personal and commercial use.
Author: Awesome Content