
- Home >
- Stock Videos >
- Financial Data Analysis with Graphs and Charts Projection
Financial Data Analysis with Graphs and Charts Projection Video
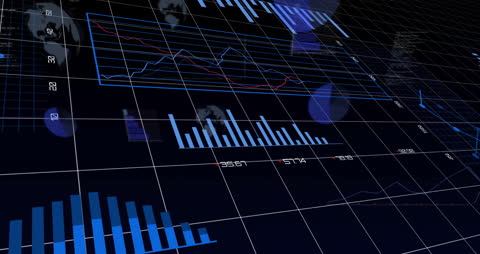
Graphics displaying financial data with line graphs, bar charts, and global elements projected on a dark background. Suitable for content related to business analysis, market forecasting, technology in finance or visual data representation.
Powered by 


Credit Photo
If you would like to credit the Photo, here are some ways you can do so
Text Link
video Link
<span class="text-link">
<span>
<a target="_blank" href=https://pikwizard.com/video/financial-data-analysis-with-graphs-and-charts-projection/ca9068c6eb5abc23cc47233d079e715d/>PikWizard</a>
</span>
</span>
<span class="image-link">
<span
style="margin: 0 0 20px 0; display: inline-block; vertical-align: middle; width: 100%;"
>
<a
target="_blank"
href="https://pikwizard.com/video/financial-data-analysis-with-graphs-and-charts-projection/ca9068c6eb5abc23cc47233d079e715d/"
style="text-decoration: none; font-size: 10px; margin: 0;"
>
<video controls style="width: 100%; margin: 0;">
<source src="https://player.vimeo.com/progressive_redirect/playback/913851780/rendition/240p/file.mp4?loc=external&oauth2_token_id=1223210874&signature=3ae23e713d71bc2b6941babce4008b774f5f8cbd9472f9ca6cbf1a95c6daec12" type="video/mp4"
poster="https://pikwizard.com/pw/medium/ca9068c6eb5abc23cc47233d079e715d.jpg"/>
Your browser does not support the video tag.
</video>
<p style="font-size: 12px; margin: 0;">PikWizard</p>
</a>
</span>
</span>
Free (free of charge)
Free for personal and commercial use.
Author: Awesome Content