
- Home >
- Stock Videos >
- Financial Data Analysis with Mobile and Desktop Integration
Financial Data Analysis with Mobile and Desktop Integration Video
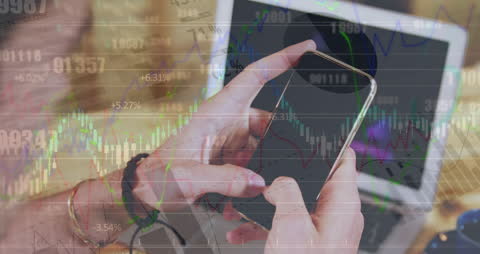
A business person's hands using a smartphone while stock market data overlays are visible represents the intersection of technology and finance. The combination of mobile and desktop devices highlights efficiency and connectivity vital for financial professionals. Useful for illustrating themes of modern business environments, financial analysis, and integration of technology in finance.

downloads
Tags:
More
Credit Photo
If you would like to credit the Photo, here are some ways you can do so
Text Link
video Link
<span class="text-link">
<span>
<a target="_blank" href=https://pikwizard.com/video/financial-data-analysis-with-mobile-and-desktop-integration/1531effefd219f63851ad89d26f20529/>PikWizard</a>
</span>
</span>
<span class="image-link">
<span
style="margin: 0 0 20px 0; display: inline-block; vertical-align: middle; width: 100%;"
>
<a
target="_blank"
href="https://pikwizard.com/video/financial-data-analysis-with-mobile-and-desktop-integration/1531effefd219f63851ad89d26f20529/"
style="text-decoration: none; font-size: 10px; margin: 0;"
>
<video controls style="width: 100%; margin: 0;">
<source src="https://player.vimeo.com/progressive_redirect/playback/719892757/rendition/240p/file.mp4?loc=external&oauth2_token_id=1223210874&signature=70b21062d4dfb5c1ebf90f65c0c598171862271d6adacd2dcdd8dbcd7326474b" type="video/mp4"
poster="https://pikwizard.com/pw/medium/1531effefd219f63851ad89d26f20529.jpg"/>
Your browser does not support the video tag.
</video>
<p style="font-size: 12px; margin: 0;">PikWizard</p>
</a>
</span>
</span>
Free (free of charge)
Free for personal and commercial use.
Author: Awesome Content