
- Home >
- Stock Videos >
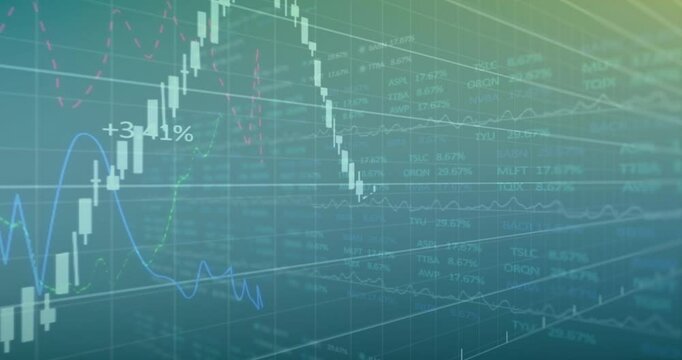
- Financial Data Analysis with Stock Market Graphs Overlap
Financial Data Analysis with Stock Market Graphs Overlap Video
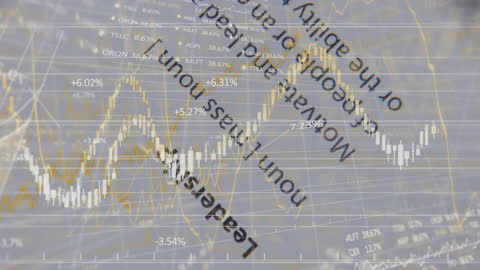
This depiction of stock market data and financial graphs merging can be effectively used in business articles, economic studies, and reports about global finance. These elements illustrate market analysis, investment strategies, and economic growth, making it suitable for content focusing on financial literacy and economic forecasting.
Powered by 


0
downloads
downloads
Tags:
More
Credit Photo
If you would like to credit the Photo, here are some ways you can do so
Text Link
video Link
<span class="text-link">
<span>
<a target="_blank" href=https://pikwizard.com/video/financial-data-analysis-with-stock-market-graphs-overlap/66de2d7418272a1ae3cd3680157cb6cb/>PikWizard</a>
</span>
</span>
<span class="image-link">
<span
style="margin: 0 0 20px 0; display: inline-block; vertical-align: middle; width: 100%;"
>
<a
target="_blank"
href="https://pikwizard.com/video/financial-data-analysis-with-stock-market-graphs-overlap/66de2d7418272a1ae3cd3680157cb6cb/"
style="text-decoration: none; font-size: 10px; margin: 0;"
>
<video controls style="width: 100%; margin: 0;">
<source src="https://player.vimeo.com/progressive_redirect/playback/758931338/rendition/240p/file.mp4?loc=external&oauth2_token_id=1223210874&signature=f1a31d00e29dfc7b73dabb30df67d23e625ebb459bbc08114cd0b366828f1e22" type="video/mp4"
poster="https://pikwizard.com/pw/medium/66de2d7418272a1ae3cd3680157cb6cb.jpg"/>
Your browser does not support the video tag.
</video>
<p style="font-size: 12px; margin: 0;">PikWizard</p>
</a>
</span>
</span>
Free (free of charge)
Free for personal and commercial use.
Author: Awesome Content