
- Home >
- Stock Videos >
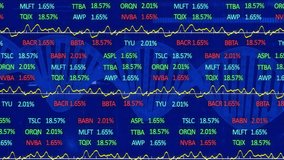
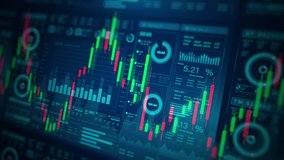
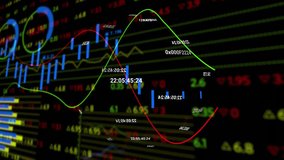
- Financial Data Analytics Visualization Over Computer Servers
Financial Data Analytics Visualization Over Computer Servers Video
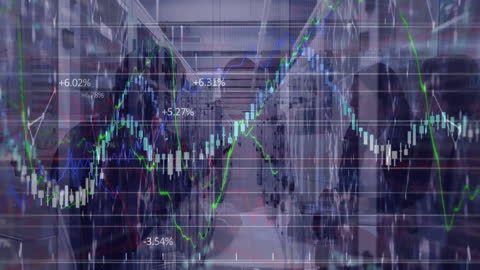
Financial data visualization overlaid on computer servers displays dynamic analytics and market growth percentages. This video represents the integration of technology and business analytics, perfect for illustrating concepts like financial technology, stock market analysis, and global business strategies. Suitable for use in articles, presentations, and educational materials on financial computing and global connectivity.
Powered by  - Get 15% off with code: PIKWIZARD15


downloads
Tags:
More
Credit Photo
If you would like to credit the Photo, here are some ways you can do so
Text Link
video Link
<span class="text-link">
<span>
<a target="_blank" href=https://pikwizard.com/video/financial-data-analytics-visualization-over-computer-servers/136e050f208c5a6bfa3d31d6d42fa36e/>PikWizard</a>
</span>
</span>
<span class="image-link">
<span
style="margin: 0 0 20px 0; display: inline-block; vertical-align: middle; width: 100%;"
>
<a
target="_blank"
href="https://pikwizard.com/video/financial-data-analytics-visualization-over-computer-servers/136e050f208c5a6bfa3d31d6d42fa36e/"
style="text-decoration: none; font-size: 10px; margin: 0;"
>
<video controls style="width: 100%; margin: 0;">
<source src="https://player.vimeo.com/progressive_redirect/playback/759249156/rendition/240p/file.mp4?loc=external&oauth2_token_id=1223210874&signature=8a6544b3a27f362daaa703a1b6bb160cd8b105b466538cf8580ae6801f321081" type="video/mp4"
poster="https://pikwizard.com/pw/medium/136e050f208c5a6bfa3d31d6d42fa36e.jpg"/>
Your browser does not support the video tag.
</video>
<p style="font-size: 12px; margin: 0;">PikWizard</p>
</a>
</span>
</span>
Free (free of charge)
Free for personal and commercial use.
Author: Awesome Content