
- Home >
- Stock Videos >
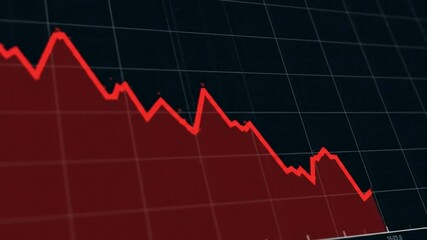
- Financial Data Animation with Graphs on Digital Grid
Financial Data Animation with Graphs on Digital Grid Video

This representation of digital financial data emphasizes technology and advanced analytics. Use in contexts related to finance, global business, data processing, and fintech innovations. Ideal for presentations on economic forecasting, technological advancements in financial markets, and data-driven decision-making strategies.
Powered by 


downloads
Tags:
More
Credit Photo
If you would like to credit the Photo, here are some ways you can do so
Text Link
video Link
<span class="text-link">
<span>
<a target="_blank" href=https://pikwizard.com/video/financial-data-animation-with-graphs-on-digital-grid/7df2f3b57004c7b7bccda8f18741be7a/>PikWizard</a>
</span>
</span>
<span class="image-link">
<span
style="margin: 0 0 20px 0; display: inline-block; vertical-align: middle; width: 100%;"
>
<a
target="_blank"
href="https://pikwizard.com/video/financial-data-animation-with-graphs-on-digital-grid/7df2f3b57004c7b7bccda8f18741be7a/"
style="text-decoration: none; font-size: 10px; margin: 0;"
>
<video controls style="width: 100%; margin: 0;">
<source src="https://player.vimeo.com/progressive_redirect/playback/912750270/rendition/240p/file.mp4?loc=external&oauth2_token_id=1223210874&signature=b1a14f6b9d96fb783c01ef469e54a31ce07d09b2f7fffd3836b035cf42ae98d8" type="video/mp4"
poster="https://pikwizard.com/pw/medium/7df2f3b57004c7b7bccda8f18741be7a.jpg"/>
Your browser does not support the video tag.
</video>
<p style="font-size: 12px; margin: 0;">PikWizard</p>
</a>
</span>
</span>
Free (free of charge)
Free for personal and commercial use.
Author: Awesome Content