
- Home >
- Stock Videos >
- Financial Data Animation with Increasing Graph Overlay
Financial Data Animation with Increasing Graph Overlay Video
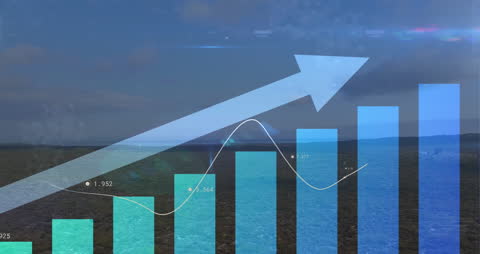
Visual illustrates animation of financial data processing with an increasing graph overlay, ideal for presentations on global finance, economic trends, or business growth strategies. Suitable for use in financial reports, digital marketing materials, or educational resources related to economics and business development.
Powered by 


downloads
Tags:
More
Credit Photo
If you would like to credit the Photo, here are some ways you can do so
Text Link
video Link
<span class="text-link">
<span>
<a target="_blank" href=https://pikwizard.com/video/financial-data-animation-with-increasing-graph-overlay/139b8bfda96aea27d0896617a4700a97/>PikWizard</a>
</span>
</span>
<span class="image-link">
<span
style="margin: 0 0 20px 0; display: inline-block; vertical-align: middle; width: 100%;"
>
<a
target="_blank"
href="https://pikwizard.com/video/financial-data-animation-with-increasing-graph-overlay/139b8bfda96aea27d0896617a4700a97/"
style="text-decoration: none; font-size: 10px; margin: 0;"
>
<video controls style="width: 100%; margin: 0;">
<source src="https://player.vimeo.com/progressive_redirect/playback/748215007/rendition/240p/file.mp4?loc=external&oauth2_token_id=1223210874&signature=cc48967cf6df7da8a161e67535315f6ced366e7b9736bd00687b9907645529a3" type="video/mp4"
poster="https://pikwizard.com/pw/medium/139b8bfda96aea27d0896617a4700a97.jpg"/>
Your browser does not support the video tag.
</video>
<p style="font-size: 12px; margin: 0;">PikWizard</p>
</a>
</span>
</span>
Free (free of charge)
Free for personal and commercial use.
Author: Awesome Content