
- Home >
- Stock Videos >
- Financial Data Bar Graph on Digital Interface
Financial Data Bar Graph on Digital Interface Video
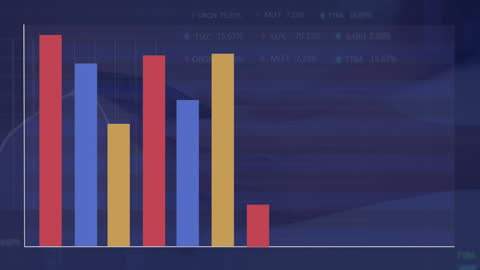
Bar graph visualization using blue, red, and yellow bars represents data analysis and financial metrics on a digital interface. Various colors indicate different parameters such as stocks or sales growth data. Suitable for presentations on financial analysis, stock market updates, business intelligence reports, or technology studies focusing on data processing and economic developments.
Powered by 


downloads
Tags:
More
Credit Photo
If you would like to credit the Photo, here are some ways you can do so
Text Link
video Link
<span class="text-link">
<span>
<a target="_blank" href=https://pikwizard.com/video/financial-data-bar-graph-on-digital-interface/03f9a8590638f361eeb8498a45e7adfe/>PikWizard</a>
</span>
</span>
<span class="image-link">
<span
style="margin: 0 0 20px 0; display: inline-block; vertical-align: middle; width: 100%;"
>
<a
target="_blank"
href="https://pikwizard.com/video/financial-data-bar-graph-on-digital-interface/03f9a8590638f361eeb8498a45e7adfe/"
style="text-decoration: none; font-size: 10px; margin: 0;"
>
<video controls style="width: 100%; margin: 0;">
<source src="https://player.vimeo.com/progressive_redirect/playback/765732624/rendition/360p/file.mp4?loc=external&oauth2_token_id=1223210874&signature=f2437699d98da869da1d857d2f5de26010a39e782df7153b1f0b0482022a6af1" type="video/mp4"
poster="https://pikwizard.com/pw/medium/03f9a8590638f361eeb8498a45e7adfe.jpg"/>
Your browser does not support the video tag.
</video>
<p style="font-size: 12px; margin: 0;">PikWizard</p>
</a>
</span>
</span>
Free (free of charge)
Free for personal and commercial use.
Author: Awesome Content