
- Home >
- Stock Videos >
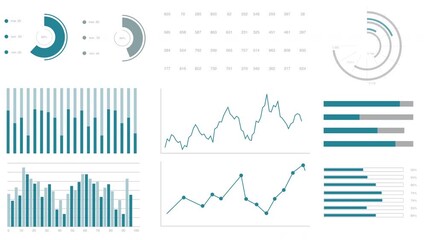
- Financial Data Chart with Dynamic Lines and Graphs
Financial Data Chart with Dynamic Lines and Graphs Video
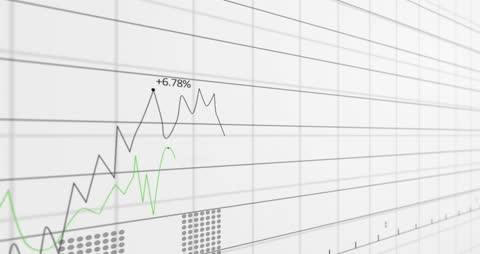
This video portrays dynamic lines and graphs on a grid, commonly seen in financial data analysis and business presentations. It is ideal for illustrating concepts related to stock market evaluations, business strategy sessions, or economic trend reports. Useful resource for financial blogs, economic reports, or business consultation related explanations.
Powered by 


downloads
Tags:
More
Credit Photo
If you would like to credit the Photo, here are some ways you can do so
Text Link
video Link
<span class="text-link">
<span>
<a target="_blank" href=https://pikwizard.com/video/financial-data-chart-with-dynamic-lines-and-graphs/5ec8b4719bac0973d6a450a9430f3518/>PikWizard</a>
</span>
</span>
<span class="image-link">
<span
style="margin: 0 0 20px 0; display: inline-block; vertical-align: middle; width: 100%;"
>
<a
target="_blank"
href="https://pikwizard.com/video/financial-data-chart-with-dynamic-lines-and-graphs/5ec8b4719bac0973d6a450a9430f3518/"
style="text-decoration: none; font-size: 10px; margin: 0;"
>
<video controls style="width: 100%; margin: 0;">
<source src="https://player.vimeo.com/progressive_redirect/playback/821825501/rendition/240p/file.mp4?loc=external&oauth2_token_id=1223210874&signature=2329817df03667e44dc8235d08a69eb2167aab9ad599feca85bc5efee34d7f1a" type="video/mp4"
poster="https://pikwizard.com/pw/medium/5ec8b4719bac0973d6a450a9430f3518.jpg"/>
Your browser does not support the video tag.
</video>
<p style="font-size: 12px; margin: 0;">PikWizard</p>
</a>
</span>
</span>
Free (free of charge)
Free for personal and commercial use.
Author: Awesome Content