
- Home >
- Stock Videos >
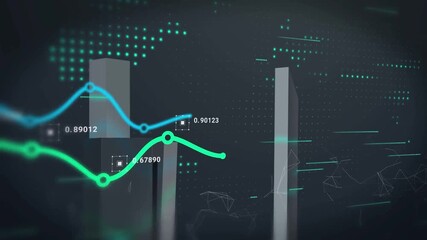
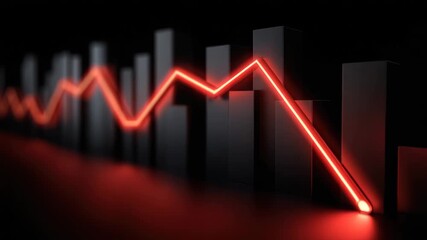
- Financial Data Charts with Bar and Line Graph Analysis
Financial Data Charts with Bar and Line Graph Analysis Video
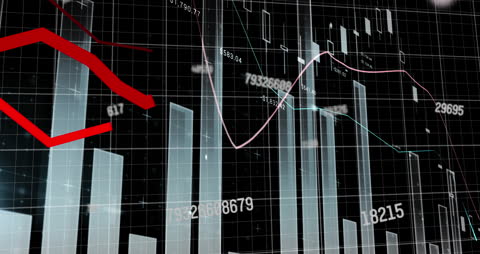
Visual represents complex financial data with overlapping bar and line graphs, highlighting trends and patterns. Ideal for use in presentations on financial analysis, stock market reports, or educational materials on data representation and global business insights.
Powered by 


downloads
Tags:
More
Credit Photo
If you would like to credit the Photo, here are some ways you can do so
Text Link
video Link
<span class="text-link">
<span>
<a target="_blank" href=https://pikwizard.com/video/financial-data-charts-with-bar-and-line-graph-analysis/1d71ec770a2af240ec15d9dd6cec0b1b/>PikWizard</a>
</span>
</span>
<span class="image-link">
<span
style="margin: 0 0 20px 0; display: inline-block; vertical-align: middle; width: 100%;"
>
<a
target="_blank"
href="https://pikwizard.com/video/financial-data-charts-with-bar-and-line-graph-analysis/1d71ec770a2af240ec15d9dd6cec0b1b/"
style="text-decoration: none; font-size: 10px; margin: 0;"
>
<video controls style="width: 100%; margin: 0;">
<source src="https://player.vimeo.com/progressive_redirect/playback/770947238/rendition/240p/file.mp4?loc=external&oauth2_token_id=1223210874&signature=73159c5f4c4bf5f04e42173b760ea93631fa1152543e3766472a28a2df28e614" type="video/mp4"
poster="https://pikwizard.com/pw/medium/1d71ec770a2af240ec15d9dd6cec0b1b.jpg"/>
Your browser does not support the video tag.
</video>
<p style="font-size: 12px; margin: 0;">PikWizard</p>
</a>
</span>
</span>
Free (free of charge)
Free for personal and commercial use.
Author: Awesome Content
Similar Free Stock Videos
Loading...