
- Home >
- Stock Videos >
- Financial Data Display With Stock Market Animation
Financial Data Display With Stock Market Animation Video
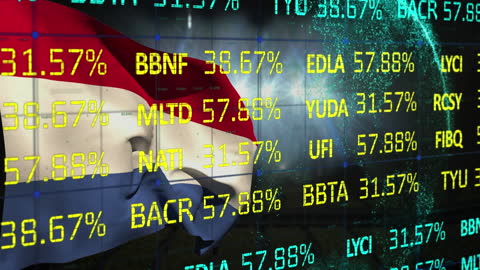
Animation features cascading stock market data with percentage changes reflecting financial transactions. Bright digital display effectively shows fluctuating stock values or economic indicators. Ideal for illustrations of global finance themes, economic reports, market analysis blogs, or presentations on trends and investment strategies. Use for highlighting technology in economic data processing or to create engaging multimedia content focused on financial insights and updates.
Powered by 


1
downloads
downloads
Tags:
More
Credit Photo
If you would like to credit the Photo, here are some ways you can do so
Text Link
video Link
<span class="text-link">
<span>
<a target="_blank" href=https://pikwizard.com/video/financial-data-display-with-stock-market-animation/b7335f643798084db5f0cb2fca4a1abc/>PikWizard</a>
</span>
</span>
<span class="image-link">
<span
style="margin: 0 0 20px 0; display: inline-block; vertical-align: middle; width: 100%;"
>
<a
target="_blank"
href="https://pikwizard.com/video/financial-data-display-with-stock-market-animation/b7335f643798084db5f0cb2fca4a1abc/"
style="text-decoration: none; font-size: 10px; margin: 0;"
>
<video controls style="width: 100%; margin: 0;">
<source src="https://player.vimeo.com/progressive_redirect/playback/911375220/rendition/240p/file.mp4?loc=external&oauth2_token_id=1223210874&signature=07c0c8e02fac3c7827469c17fdd5ce443704bbe681a991e35737a3a34da9d343" type="video/mp4"
poster="https://pikwizard.com/pw/medium/b7335f643798084db5f0cb2fca4a1abc.jpg"/>
Your browser does not support the video tag.
</video>
<p style="font-size: 12px; margin: 0;">PikWizard</p>
</a>
</span>
</span>
Free (free of charge)
Free for personal and commercial use.
Author: Awesome Content