
- Home >
- Stock Videos >
- Financial Data Graph Animation in Virtual Grid View
Financial Data Graph Animation in Virtual Grid View Video
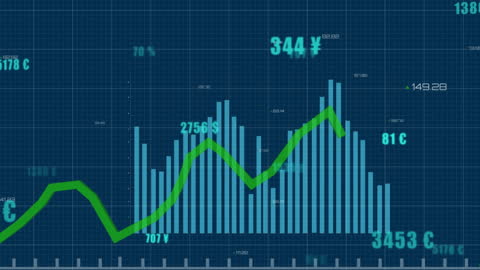
Animated style depicting financial data trends in a virtual grid interface. Ideal for finance-related content, economic reports, trading education materials, and visual representation of stock market analyses. Use to emphasize digital advancements in financial technology and data visualization.

downloads
Tags:
More
Credit Photo
If you would like to credit the Photo, here are some ways you can do so
Text Link
video Link
<span class="text-link">
<span>
<a target="_blank" href=https://pikwizard.com/video/financial-data-graph-animation-in-virtual-grid-view/f620d39fd920924fbe1a858b1bc56689/>PikWizard</a>
</span>
</span>
<span class="image-link">
<span
style="margin: 0 0 20px 0; display: inline-block; vertical-align: middle; width: 100%;"
>
<a
target="_blank"
href="https://pikwizard.com/video/financial-data-graph-animation-in-virtual-grid-view/f620d39fd920924fbe1a858b1bc56689/"
style="text-decoration: none; font-size: 10px; margin: 0;"
>
<video controls style="width: 100%; margin: 0;">
<source src="https://player.vimeo.com/progressive_redirect/playback/806113123/rendition/240p/file.mp4?loc=external&oauth2_token_id=1223210874&signature=2e0ea82f536581c0aba63c8d06207807de356e2c3e5bd61e271fd61b9ffd34bf" type="video/mp4"
poster="https://pikwizard.com/pw/medium/f620d39fd920924fbe1a858b1bc56689.jpg"/>
Your browser does not support the video tag.
</video>
<p style="font-size: 12px; margin: 0;">PikWizard</p>
</a>
</span>
</span>
Free (free of charge)
Free for personal and commercial use.
Author: Awesome Content