
- Home >
- Stock Videos >
- Financial Data Overlaid on Urban Skyline Showing Economic Trends
Financial Data Overlaid on Urban Skyline Showing Economic Trends Video
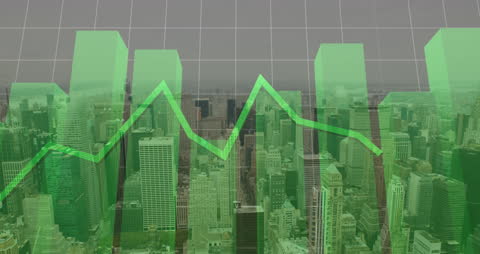
Vibrant green graph interspersed with bars overlays an expansive urban skyline, signifying economic activity and trends in a financial analysis context. Ideal for illustrating concepts of stock market fluctuations, investment discussions, and economic growth projections for use in business presentations, financial reports, or technology articles.
Powered by  - Get 15% off with code: PIKWIZARD15


downloads
Tags:
More
Credit Photo
If you would like to credit the Photo, here are some ways you can do so
Text Link
video Link
<span class="text-link">
<span>
<a target="_blank" href=https://pikwizard.com/video/financial-data-overlaid-on-urban-skyline-showing-economic-trends/e17f796bbcd7811ea32657b774914b2b/>PikWizard</a>
</span>
</span>
<span class="image-link">
<span
style="margin: 0 0 20px 0; display: inline-block; vertical-align: middle; width: 100%;"
>
<a
target="_blank"
href="https://pikwizard.com/video/financial-data-overlaid-on-urban-skyline-showing-economic-trends/e17f796bbcd7811ea32657b774914b2b/"
style="text-decoration: none; font-size: 10px; margin: 0;"
>
<video controls style="width: 100%; margin: 0;">
<source src="https://player.vimeo.com/progressive_redirect/playback/912748343/rendition/240p/file.mp4?loc=external&oauth2_token_id=1223210874&signature=f75b98c193c91a9aa1bef23365a4c4390ac366bf06e95fd83fb943be0fb229f7" type="video/mp4"
poster="https://pikwizard.com/pw/medium/e17f796bbcd7811ea32657b774914b2b.jpg"/>
Your browser does not support the video tag.
</video>
<p style="font-size: 12px; margin: 0;">PikWizard</p>
</a>
</span>
</span>
Free (free of charge)
Free for personal and commercial use.
Author: Awesome Content