
- Home >
- Stock Videos >
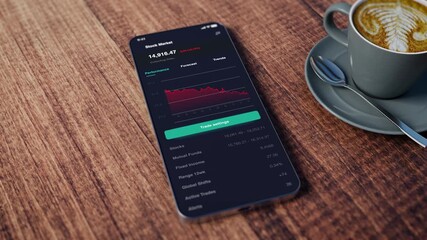
- Financial Data Overlapping Shopping Context
Financial Data Overlapping Shopping Context Video

Depicts stock market indices and financial data blended with an video of a shopping cart. Reflects dynamics of retail marketplace with sensitivity to economic indicators. May be useful for articles on consumer buying trends, economics, or retail industry reports. Ideal for illustrating the relationship between financial markets and consumer behaviors.
Powered by 


downloads
Tags:
More
Credit Photo
If you would like to credit the Photo, here are some ways you can do so
Text Link
video Link
<span class="text-link">
<span>
<a target="_blank" href=https://pikwizard.com/video/financial-data-overlapping-shopping-context/7f236e12615796d48e65fb7062d06642/>PikWizard</a>
</span>
</span>
<span class="image-link">
<span
style="margin: 0 0 20px 0; display: inline-block; vertical-align: middle; width: 100%;"
>
<a
target="_blank"
href="https://pikwizard.com/video/financial-data-overlapping-shopping-context/7f236e12615796d48e65fb7062d06642/"
style="text-decoration: none; font-size: 10px; margin: 0;"
>
<video controls style="width: 100%; margin: 0;">
<source src="https://player.vimeo.com/progressive_redirect/playback/846156994/rendition/240p/file.mp4?loc=external&oauth2_token_id=1223210874&signature=4eb083b336d008824887698d65443ec723881d702015b68e3c540b1edddd51d4" type="video/mp4"
poster="https://pikwizard.com/pw/medium/7f236e12615796d48e65fb7062d06642.jpg"/>
Your browser does not support the video tag.
</video>
<p style="font-size: 12px; margin: 0;">PikWizard</p>
</a>
</span>
</span>
Free (free of charge)
Free for personal and commercial use.
Author: Awesome Content