
- Home >
- Stock Videos >
- Financial Data Overlay with Compass Graphic Animation
Financial Data Overlay with Compass Graphic Animation Video
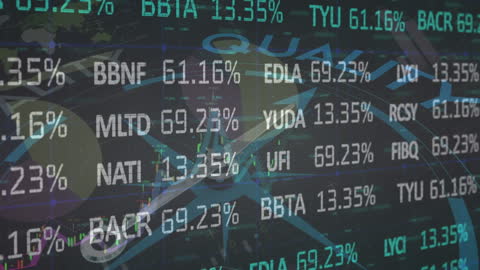
Illustration of intricate financial data and stock market percentages overlaid with a compass graphic. Perfect for articles and presentations related to global business strategies, financial forecasting, economic trends, digital transformation in finance, or educational resources in stock market analysis.
Powered by 


downloads
Tags:
More
Credit Photo
If you would like to credit the Photo, here are some ways you can do so
Text Link
video Link
<span class="text-link">
<span>
<a target="_blank" href=https://pikwizard.com/video/financial-data-overlay-with-compass-graphic-animation/0dc68e94c239d46a5d324df2d7b60af3/>PikWizard</a>
</span>
</span>
<span class="image-link">
<span
style="margin: 0 0 20px 0; display: inline-block; vertical-align: middle; width: 100%;"
>
<a
target="_blank"
href="https://pikwizard.com/video/financial-data-overlay-with-compass-graphic-animation/0dc68e94c239d46a5d324df2d7b60af3/"
style="text-decoration: none; font-size: 10px; margin: 0;"
>
<video controls style="width: 100%; margin: 0;">
<source src="https://player.vimeo.com/progressive_redirect/playback/846154656/rendition/240p/file.mp4?loc=external&oauth2_token_id=1223210874&signature=1d9755c9a68d89b88cea2d0efce5b83f1cb53ee66afc85aaa4750057059b8b0d" type="video/mp4"
poster="https://pikwizard.com/pw/medium/0dc68e94c239d46a5d324df2d7b60af3.jpg"/>
Your browser does not support the video tag.
</video>
<p style="font-size: 12px; margin: 0;">PikWizard</p>
</a>
</span>
</span>
Free (free of charge)
Free for personal and commercial use.
Author: Awesome Content