
- Home >
- Stock Videos >
- Financial Data Overlaying Junkyard Machinery Reflection
Financial Data Overlaying Junkyard Machinery Reflection Video
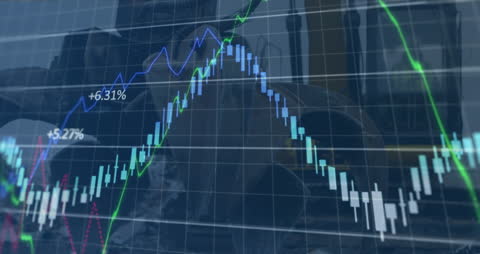
Graph illustrating financial data with potential for presentations, articles, or media content on market trends, economic conditions, or sustainability efforts in industry sectors. Useful for visualizing impact of financial policies or recycling and waste utilization strategies.
Powered by 


2
downloads
downloads
Tags:
More
Credit Photo
If you would like to credit the Photo, here are some ways you can do so
Text Link
video Link
<span class="text-link">
<span>
<a target="_blank" href=https://pikwizard.com/video/financial-data-overlaying-junkyard-machinery-reflection/b07ecc721cbb285d23787dc7a9571f91/>PikWizard</a>
</span>
</span>
<span class="image-link">
<span
style="margin: 0 0 20px 0; display: inline-block; vertical-align: middle; width: 100%;"
>
<a
target="_blank"
href="https://pikwizard.com/video/financial-data-overlaying-junkyard-machinery-reflection/b07ecc721cbb285d23787dc7a9571f91/"
style="text-decoration: none; font-size: 10px; margin: 0;"
>
<video controls style="width: 100%; margin: 0;">
<source src="https://player.vimeo.com/progressive_redirect/playback/717213905/rendition/240p/file.mp4?loc=external&oauth2_token_id=1223210874&signature=b0aef92c6415a52a4c36c7c2fb92f247ff9fcc0f26aec9d50137e6580ee5eed1" type="video/mp4"
poster="https://pikwizard.com/pw/medium/b07ecc721cbb285d23787dc7a9571f91.jpg"/>
Your browser does not support the video tag.
</video>
<p style="font-size: 12px; margin: 0;">PikWizard</p>
</a>
</span>
</span>
Free (free of charge)
Free for personal and commercial use.
Author: Awesome Content