
- Home >
- Stock Videos >
- Financial Data Processing and Analysis with Rising Graph Lines
Financial Data Processing and Analysis with Rising Graph Lines Video
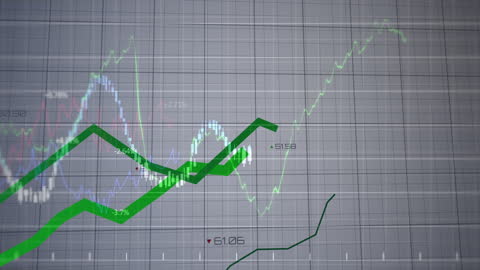
Rising green graph lines illustrate financial data and market trends over a digital grid backdrop. This dynamic design is suitable for financial reports, business presentations, or marketing materials related to investment or stock market analysis.

downloads
Tags:
More
Credit Photo
If you would like to credit the Photo, here are some ways you can do so
Text Link
video Link
<span class="text-link">
<span>
<a target="_blank" href=https://pikwizard.com/video/financial-data-processing-and-analysis-with-rising-graph-lines/9753b2264d944838644bcbbf8e9e63d6/>PikWizard</a>
</span>
</span>
<span class="image-link">
<span
style="margin: 0 0 20px 0; display: inline-block; vertical-align: middle; width: 100%;"
>
<a
target="_blank"
href="https://pikwizard.com/video/financial-data-processing-and-analysis-with-rising-graph-lines/9753b2264d944838644bcbbf8e9e63d6/"
style="text-decoration: none; font-size: 10px; margin: 0;"
>
<video controls style="width: 100%; margin: 0;">
<source src="https://player.vimeo.com/progressive_redirect/playback/717903963/rendition/240p/file.mp4?loc=external&oauth2_token_id=1223210874&signature=18db9297a4d43cbb2405e2b4e1017dc838704ec99c26a68965228698a6c5a66f" type="video/mp4"
poster="https://pikwizard.com/pw/medium/9753b2264d944838644bcbbf8e9e63d6.jpg"/>
Your browser does not support the video tag.
</video>
<p style="font-size: 12px; margin: 0;">PikWizard</p>
</a>
</span>
</span>
Free (free of charge)
Free for personal and commercial use.
Author: Awesome Content