
- Home >
- Stock Videos >
- Financial Data Processing Animated Chart Overview
Financial Data Processing Animated Chart Overview Video
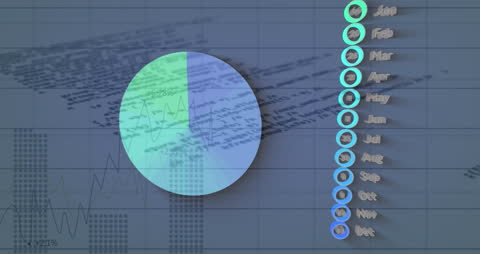
Visualization of financial data with a pie chart shows monthly comparisons and economic trends. Useful for business presentations, educational resources, and financial forecasting materials.

downloads
Tags:
More
Credit Photo
If you would like to credit the Photo, here are some ways you can do so
Text Link
video Link
<span class="text-link">
<span>
<a target="_blank" href=https://pikwizard.com/video/financial-data-processing-animated-chart-overview/6edc73581e12285c2d1db5bb7ae7b8d2/>PikWizard</a>
</span>
</span>
<span class="image-link">
<span
style="margin: 0 0 20px 0; display: inline-block; vertical-align: middle; width: 100%;"
>
<a
target="_blank"
href="https://pikwizard.com/video/financial-data-processing-animated-chart-overview/6edc73581e12285c2d1db5bb7ae7b8d2/"
style="text-decoration: none; font-size: 10px; margin: 0;"
>
<video controls style="width: 100%; margin: 0;">
<source src="https://player.vimeo.com/progressive_redirect/playback/775201383/rendition/240p/file.mp4?loc=external&oauth2_token_id=1223210874&signature=cf5b57a81133b6e6dfdaccb28f3f432ad260004559eb03ea112de8ee5c02d6e9" type="video/mp4"
poster="https://pikwizard.com/pw/medium/6edc73581e12285c2d1db5bb7ae7b8d2.jpg"/>
Your browser does not support the video tag.
</video>
<p style="font-size: 12px; margin: 0;">PikWizard</p>
</a>
</span>
</span>
Free (free of charge)
Free for personal and commercial use.
Author: Awesome Content