
- Home >
- Stock Videos >
- Financial Data Processing Animation with Digital Neon Numbers and Graphs
Financial Data Processing Animation with Digital Neon Numbers and Graphs Video
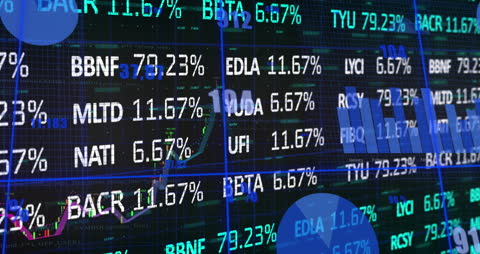
This visual is rich with digital numbers and fluctuating graphs, representing the evolving financial markets. The dynamic neon blue font captures the fast-paced essence of stock trading, ideal for illustrating finance, technology, or data processing themes. Perfect for use in presentations, explainer videos, or blogs about global business, market analysis, and technological advancements.
Powered by  - Get 15% off with code: PIKWIZARD15


downloads
Tags:
More
Credit Photo
If you would like to credit the Photo, here are some ways you can do so
Text Link
video Link
<span class="text-link">
<span>
<a target="_blank" href=https://pikwizard.com/video/financial-data-processing-animation-with-digital-neon-numbers-and-graphs/873da0543a495f81619f1549822b8b6f/>PikWizard</a>
</span>
</span>
<span class="image-link">
<span
style="margin: 0 0 20px 0; display: inline-block; vertical-align: middle; width: 100%;"
>
<a
target="_blank"
href="https://pikwizard.com/video/financial-data-processing-animation-with-digital-neon-numbers-and-graphs/873da0543a495f81619f1549822b8b6f/"
style="text-decoration: none; font-size: 10px; margin: 0;"
>
<video controls style="width: 100%; margin: 0;">
<source src="https://player.vimeo.com/progressive_redirect/playback/760270167/rendition/240p/file.mp4?loc=external&oauth2_token_id=1223210874&signature=30a0c9deecafe12ee3655cbf6fbadb882e636a66ea57f75071ddf74b566fbf72" type="video/mp4"
poster="https://pikwizard.com/pw/medium/873da0543a495f81619f1549822b8b6f.jpg"/>
Your browser does not support the video tag.
</video>
<p style="font-size: 12px; margin: 0;">PikWizard</p>
</a>
</span>
</span>
Free (free of charge)
Free for personal and commercial use.
Author: Awesome Content
Similar Free Stock Videos
Loading...