
- Home >
- Stock Videos >
- Financial Data Processing Animation with Graphs and Charts
Financial Data Processing Animation with Graphs and Charts Video
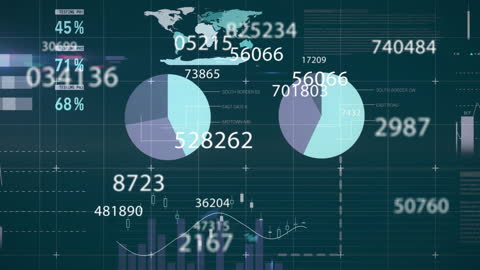
Animation presents complex data in an engaging, visual format featuring charts, graphs, and numerical data. Ideal for finance-related presentations, educational materials, or technology-focused content. Useful for conveying economic trends or statistical analysis concepts in multimedia projects.
Powered by 


downloads
Tags:
More
Credit Photo
If you would like to credit the Photo, here are some ways you can do so
Text Link
video Link
<span class="text-link">
<span>
<a target="_blank" href=https://pikwizard.com/video/financial-data-processing-animation-with-graphs-and-charts/2cb1e4c2899e1c95f6922cd2141c9428/>PikWizard</a>
</span>
</span>
<span class="image-link">
<span
style="margin: 0 0 20px 0; display: inline-block; vertical-align: middle; width: 100%;"
>
<a
target="_blank"
href="https://pikwizard.com/video/financial-data-processing-animation-with-graphs-and-charts/2cb1e4c2899e1c95f6922cd2141c9428/"
style="text-decoration: none; font-size: 10px; margin: 0;"
>
<video controls style="width: 100%; margin: 0;">
<source src="https://player.vimeo.com/progressive_redirect/playback/907875830/rendition/240p/file.mp4?loc=external&oauth2_token_id=1223210874&signature=8000ae27ba858b5040d18e1738b06e863f5726eae2e660e17fb026dbf5c4e5d6" type="video/mp4"
poster="https://pikwizard.com/pw/medium/2cb1e4c2899e1c95f6922cd2141c9428.jpg"/>
Your browser does not support the video tag.
</video>
<p style="font-size: 12px; margin: 0;">PikWizard</p>
</a>
</span>
</span>
Free (free of charge)
Free for personal and commercial use.
Author: Awesome Content