
- Home >
- Stock Videos >
- Financial Data Processing with Animated Line Graph on Dark Background
Financial Data Processing with Animated Line Graph on Dark Background Video
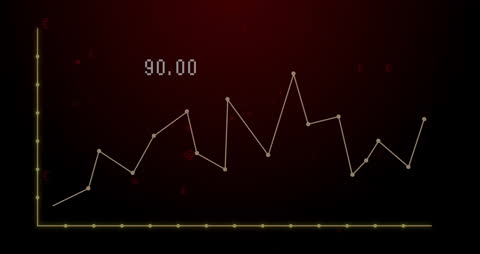
The visual illustrates financial data analysis with a dynamic line graph on a dark background enhancing the luminous yellow lines and scattered currency symbols. Ideal for presentations on business forecasts, educational purposes, or visual aids in demonstrating data analysis in financial sectors.
Powered by 


downloads
Tags:
More
Credit Photo
If you would like to credit the Photo, here are some ways you can do so
Text Link
video Link
<span class="text-link">
<span>
<a target="_blank" href=https://pikwizard.com/video/financial-data-processing-with-animated-line-graph-on-dark-background/7fb81a296c58acb2b1b5be75f9afa630/>PikWizard</a>
</span>
</span>
<span class="image-link">
<span
style="margin: 0 0 20px 0; display: inline-block; vertical-align: middle; width: 100%;"
>
<a
target="_blank"
href="https://pikwizard.com/video/financial-data-processing-with-animated-line-graph-on-dark-background/7fb81a296c58acb2b1b5be75f9afa630/"
style="text-decoration: none; font-size: 10px; margin: 0;"
>
<video controls style="width: 100%; margin: 0;">
<source src="https://player.vimeo.com/progressive_redirect/playback/934587583/rendition/240p/file.mp4?loc=external&oauth2_token_id=1223210874&signature=184a6e2249d7d12c686e8930ddc913d18b0ca59693ddd745cef9563bc6654fce" type="video/mp4"
poster="https://pikwizard.com/pw/medium/7fb81a296c58acb2b1b5be75f9afa630.jpg"/>
Your browser does not support the video tag.
</video>
<p style="font-size: 12px; margin: 0;">PikWizard</p>
</a>
</span>
</span>
Free (free of charge)
Free for personal and commercial use.
Author: Awesome Content