
- Home >
- Stock Videos >
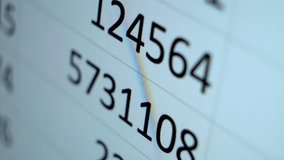
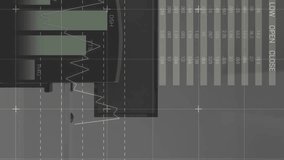
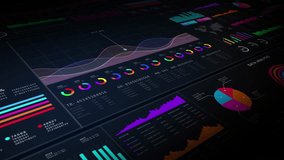
- Financial Data Processing with Digital Interface Overlays
Financial Data Processing with Digital Interface Overlays Video
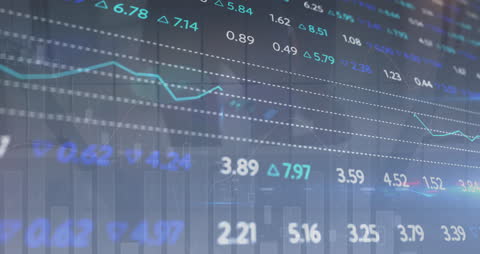
Animation displaying financial data with charts and graphs overlaying a digital interface. Ideal for finance-related presentations, business analytics, market projections, and educational videos to illustrate economic trends and stock market behavior.
Powered by  - Get 15% off with code: PIKWIZARD15


downloads
Tags:
More
Credit Photo
If you would like to credit the Photo, here are some ways you can do so
Text Link
video Link
<span class="text-link">
<span>
<a target="_blank" href=https://pikwizard.com/video/financial-data-processing-with-digital-interface-overlays/df28b930b11ddbbc2618a35daee0f7ab/>PikWizard</a>
</span>
</span>
<span class="image-link">
<span
style="margin: 0 0 20px 0; display: inline-block; vertical-align: middle; width: 100%;"
>
<a
target="_blank"
href="https://pikwizard.com/video/financial-data-processing-with-digital-interface-overlays/df28b930b11ddbbc2618a35daee0f7ab/"
style="text-decoration: none; font-size: 10px; margin: 0;"
>
<video controls style="width: 100%; margin: 0;">
<source src="https://player.vimeo.com/progressive_redirect/playback/912747548/rendition/240p/file.mp4?loc=external&oauth2_token_id=1223210874&signature=46f1332cc417978e77ffb95c093b1d9fef06360b3557619af4c7de24cb55c58b" type="video/mp4"
poster="https://pikwizard.com/pw/medium/df28b930b11ddbbc2618a35daee0f7ab.jpg"/>
Your browser does not support the video tag.
</video>
<p style="font-size: 12px; margin: 0;">PikWizard</p>
</a>
</span>
</span>
Free (free of charge)
Free for personal and commercial use.
Author: Awesome Content