
- Home >
- Stock Videos >
- Financial Data Processing with Dynamic Graph Animation
Financial Data Processing with Dynamic Graph Animation Video
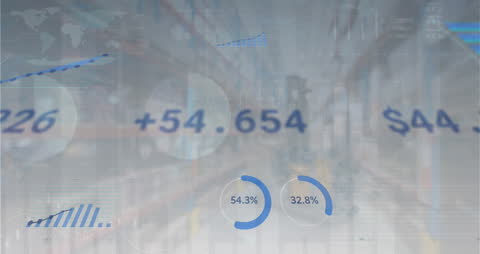
Complex display of financial data and graphical statistics highlights digital data processing. Suitable for illustrating business analytics, financial services, and economic software presentations.

downloads
Tags:
More
Credit Photo
If you would like to credit the Photo, here are some ways you can do so
Text Link
video Link
<span class="text-link">
<span>
<a target="_blank" href=https://pikwizard.com/video/financial-data-processing-with-dynamic-graph-animation/714e341f7aaf4d4ffb95ce706db545b8/>PikWizard</a>
</span>
</span>
<span class="image-link">
<span
style="margin: 0 0 20px 0; display: inline-block; vertical-align: middle; width: 100%;"
>
<a
target="_blank"
href="https://pikwizard.com/video/financial-data-processing-with-dynamic-graph-animation/714e341f7aaf4d4ffb95ce706db545b8/"
style="text-decoration: none; font-size: 10px; margin: 0;"
>
<video controls style="width: 100%; margin: 0;">
<source src="https://player.vimeo.com/progressive_redirect/playback/788975169/rendition/360p/file.mp4?loc=external&oauth2_token_id=1223210874&signature=e99022a032fd09af2d2d4ea7d50dfa55f48307c380223c44d74d0c3f7f0dc38d" type="video/mp4"
poster="https://pikwizard.com/pw/medium/714e341f7aaf4d4ffb95ce706db545b8.jpg"/>
Your browser does not support the video tag.
</video>
<p style="font-size: 12px; margin: 0;">PikWizard</p>
</a>
</span>
</span>
Free (free of charge)
Free for personal and commercial use.
Author: Awesome Content