
- Home >
- Stock Videos >
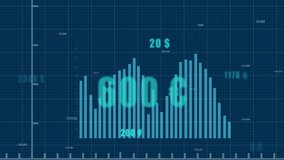
- Financial Data Processing with Graph on Digital Grid
Financial Data Processing with Graph on Digital Grid Video

Illustration shows a rising financial graph overlying a digital grid with floating numbers and symbols. This visual aids discussions on finance, data analysis, technology in business, or stock market trends. Useful for presentations, videos on digital transformation in finance, or educational content about data analytics.
Powered by  - Get 15% off with code: PIKWIZARD15


downloads
Tags:
More
Credit Photo
If you would like to credit the Photo, here are some ways you can do so
Text Link
video Link
<span class="text-link">
<span>
<a target="_blank" href=https://pikwizard.com/video/financial-data-processing-with-graph-on-digital-grid/780bb487280cda6989773229ab3d470f/>PikWizard</a>
</span>
</span>
<span class="image-link">
<span
style="margin: 0 0 20px 0; display: inline-block; vertical-align: middle; width: 100%;"
>
<a
target="_blank"
href="https://pikwizard.com/video/financial-data-processing-with-graph-on-digital-grid/780bb487280cda6989773229ab3d470f/"
style="text-decoration: none; font-size: 10px; margin: 0;"
>
<video controls style="width: 100%; margin: 0;">
<source src="https://player.vimeo.com/progressive_redirect/playback/758998723/rendition/240p/file.mp4?loc=external&oauth2_token_id=1223210874&signature=d6c673c1f1579d9459a7689d89ecd487907a272b8ce096ec80410b94924c4891" type="video/mp4"
poster="https://pikwizard.com/pw/medium/780bb487280cda6989773229ab3d470f.jpg"/>
Your browser does not support the video tag.
</video>
<p style="font-size: 12px; margin: 0;">PikWizard</p>
</a>
</span>
</span>
Free (free of charge)
Free for personal and commercial use.
Author: Awesome Content