
- Home >
- Stock Videos >
- Financial Data Processing with Stock Market Bar Graphs
Financial Data Processing with Stock Market Bar Graphs Video
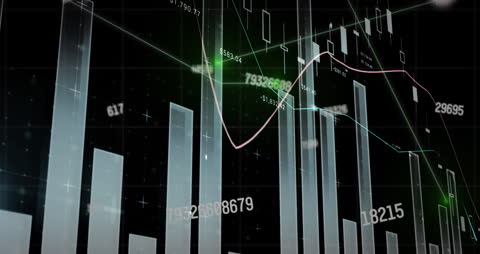
Bar and line graphs represent stock market data processing with a digital interface. This visual is ideal for materials focusing on global business, financial analysis, investment strategies, and economic growth forecasts. The dynamic design conveys action and trends in the economic sector, making it suitable for reports, presentations, or educational materials on finance.
Powered by 


downloads
Tags:
More
Credit Photo
If you would like to credit the Photo, here are some ways you can do so
Text Link
video Link
<span class="text-link">
<span>
<a target="_blank" href=https://pikwizard.com/video/financial-data-processing-with-stock-market-bar-graphs/1e4818ddd8fbe650123401b616d6b52d/>PikWizard</a>
</span>
</span>
<span class="image-link">
<span
style="margin: 0 0 20px 0; display: inline-block; vertical-align: middle; width: 100%;"
>
<a
target="_blank"
href="https://pikwizard.com/video/financial-data-processing-with-stock-market-bar-graphs/1e4818ddd8fbe650123401b616d6b52d/"
style="text-decoration: none; font-size: 10px; margin: 0;"
>
<video controls style="width: 100%; margin: 0;">
<source src="https://player.vimeo.com/progressive_redirect/playback/790374941/rendition/240p/file.mp4?loc=external&oauth2_token_id=1223210874&signature=2fd541c9b311ce8310213cd4b90325ffd6fd9613283625a34eab62c19c47b1e7" type="video/mp4"
poster="https://pikwizard.com/pw/medium/1e4818ddd8fbe650123401b616d6b52d.jpg"/>
Your browser does not support the video tag.
</video>
<p style="font-size: 12px; margin: 0;">PikWizard</p>
</a>
</span>
</span>
Free (free of charge)
Free for personal and commercial use.
Author: Awesome Content