
- Home >
- Stock Videos >
- Financial Data Visualization in Modern Office Environment
Financial Data Visualization in Modern Office Environment Video
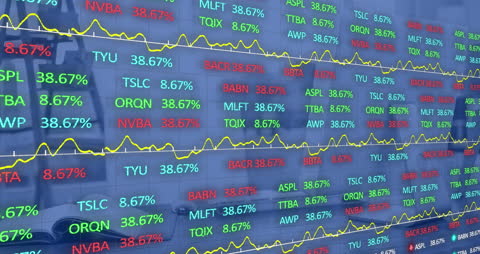
This video shows digital financial data presented in an animated format, ideal for illustrating business and financial analysis concepts. Suitable for use in contexts such as financial reports, blog posts about stock market trends, or educational content on economic principles. The dynamic visual style makes it a compelling choice for presentations or digital resources aimed at professionals in finance and business sectors.
Powered by 


downloads
Tags:
More
Credit Photo
If you would like to credit the Photo, here are some ways you can do so
Text Link
video Link
<span class="text-link">
<span>
<a target="_blank" href=https://pikwizard.com/video/financial-data-visualization-in-modern-office-environment/10688f5aa3955f9f229f998ed45a66fb/>PikWizard</a>
</span>
</span>
<span class="image-link">
<span
style="margin: 0 0 20px 0; display: inline-block; vertical-align: middle; width: 100%;"
>
<a
target="_blank"
href="https://pikwizard.com/video/financial-data-visualization-in-modern-office-environment/10688f5aa3955f9f229f998ed45a66fb/"
style="text-decoration: none; font-size: 10px; margin: 0;"
>
<video controls style="width: 100%; margin: 0;">
<source src="https://player.vimeo.com/progressive_redirect/playback/770962931/rendition/240p/file.mp4?loc=external&oauth2_token_id=1223210874&signature=805d853679af9746462109ed33d75ffc8679a88ef70e297e8a05d1d68d65fc88" type="video/mp4"
poster="https://pikwizard.com/pw/medium/10688f5aa3955f9f229f998ed45a66fb.jpg"/>
Your browser does not support the video tag.
</video>
<p style="font-size: 12px; margin: 0;">PikWizard</p>
</a>
</span>
</span>
Free (free of charge)
Free for personal and commercial use.
Author: Awesome Content