
- Home >
- Stock Videos >
- Financial Data Visualization on Modern Digital Interface
Financial Data Visualization on Modern Digital Interface Video
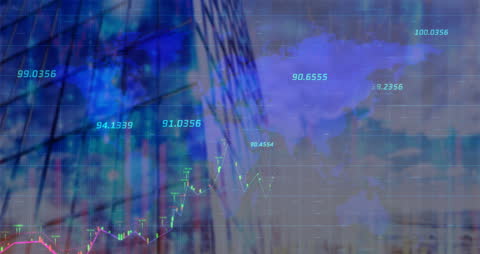
This visual creatively blends financial statistics with a cityscape, suggesting the economic impact on urban growth. The world map on the digital interface symbolizes global connectivity and financial data networking. This video is ideal for presentations or content focused on international finance, stock market trends, data analytics, or investment opportunities. Could also be useful in illustrating modern technological advancements in economic forecasting and finance management.

downloads
Tags:
More
Credit Photo
If you would like to credit the Photo, here are some ways you can do so
Text Link
video Link
<span class="text-link">
<span>
<a target="_blank" href=https://pikwizard.com/video/financial-data-visualization-on-modern-digital-interface/b6d040f2cdc577fcc03e98646434f7e5/>PikWizard</a>
</span>
</span>
<span class="image-link">
<span
style="margin: 0 0 20px 0; display: inline-block; vertical-align: middle; width: 100%;"
>
<a
target="_blank"
href="https://pikwizard.com/video/financial-data-visualization-on-modern-digital-interface/b6d040f2cdc577fcc03e98646434f7e5/"
style="text-decoration: none; font-size: 10px; margin: 0;"
>
<video controls style="width: 100%; margin: 0;">
<source src="https://player.vimeo.com/progressive_redirect/playback/717043548/rendition/240p/file.mp4?loc=external&oauth2_token_id=1223210874&signature=623906d8b8031f98c59ae4674a3ba4c9577b711f85cd3b10ef90799e07edd6bd" type="video/mp4"
poster="https://pikwizard.com/pw/medium/b6d040f2cdc577fcc03e98646434f7e5.jpg"/>
Your browser does not support the video tag.
</video>
<p style="font-size: 12px; margin: 0;">PikWizard</p>
</a>
</span>
</span>
Free (free of charge)
Free for personal and commercial use.
Author: Awesome Content