
- Home >
- Stock Videos >
- Financial Data Visualization Over Digital Ocean Landscapes
Financial Data Visualization Over Digital Ocean Landscapes Video
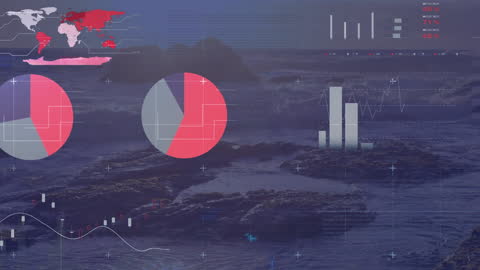
Digital video combines graphical financial data with a natural ocean landscape, featuring various charts and graphs overlaying the scene. This video represents an integration of global business analytics with environmental themes. Suitable for use in business presentations, analytical reports, marketing for financial services, or digital content discussing the intersection of nature and technology.
Powered by 


downloads
Tags:
More
Credit Photo
If you would like to credit the Photo, here are some ways you can do so
Text Link
video Link
<span class="text-link">
<span>
<a target="_blank" href=https://pikwizard.com/video/financial-data-visualization-over-digital-ocean-landscapes/a839dfe19ca923a2a8ba2c968651aa21/>PikWizard</a>
</span>
</span>
<span class="image-link">
<span
style="margin: 0 0 20px 0; display: inline-block; vertical-align: middle; width: 100%;"
>
<a
target="_blank"
href="https://pikwizard.com/video/financial-data-visualization-over-digital-ocean-landscapes/a839dfe19ca923a2a8ba2c968651aa21/"
style="text-decoration: none; font-size: 10px; margin: 0;"
>
<video controls style="width: 100%; margin: 0;">
<source src="https://player.vimeo.com/progressive_redirect/playback/758900339/rendition/240p/file.mp4?loc=external&oauth2_token_id=1223210874&signature=1dd0d387d5ba423391ef2d36a60b524a624a03c23774c99020fcf2178ddde96a" type="video/mp4"
poster="https://pikwizard.com/pw/medium/a839dfe19ca923a2a8ba2c968651aa21.jpg"/>
Your browser does not support the video tag.
</video>
<p style="font-size: 12px; margin: 0;">PikWizard</p>
</a>
</span>
</span>
Free (free of charge)
Free for personal and commercial use.
Author: Awesome Content