
- Home >
- Stock Videos >
- Financial Data Visualization over Skyline Pylons
Financial Data Visualization over Skyline Pylons Video
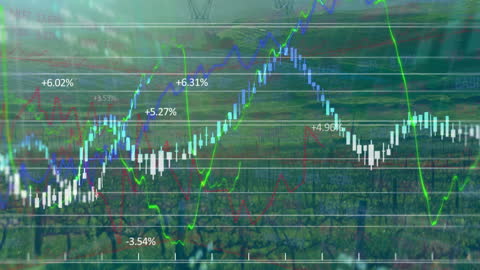
Animated digital display of financial data overlay on landscape with electrical pylons, illustrating economic trends and market fluctuations. Ideal for presentations, financial reports, technology publications and content related to global economies and technological advancements.

downloads
Tags:
More
Credit Photo
If you would like to credit the Photo, here are some ways you can do so
Text Link
video Link
<span class="text-link">
<span>
<a target="_blank" href=https://pikwizard.com/video/financial-data-visualization-over-skyline-pylons/fa853abce447faa20c5bb2da299c15ea/>PikWizard</a>
</span>
</span>
<span class="image-link">
<span
style="margin: 0 0 20px 0; display: inline-block; vertical-align: middle; width: 100%;"
>
<a
target="_blank"
href="https://pikwizard.com/video/financial-data-visualization-over-skyline-pylons/fa853abce447faa20c5bb2da299c15ea/"
style="text-decoration: none; font-size: 10px; margin: 0;"
>
<video controls style="width: 100%; margin: 0;">
<source src="https://player.vimeo.com/progressive_redirect/playback/752152336/rendition/240p/file.mp4?loc=external&oauth2_token_id=1223210874&signature=dfdebb4f9de224cb1d8d987f2e1d9bdb94296f93c4e149cfbc2d43ee823099f5" type="video/mp4"
poster="https://pikwizard.com/pw/medium/fa853abce447faa20c5bb2da299c15ea.jpg"/>
Your browser does not support the video tag.
</video>
<p style="font-size: 12px; margin: 0;">PikWizard</p>
</a>
</span>
</span>
Free (free of charge)
Free for personal and commercial use.
Author: Awesome Content