
- Home >
- Stock Videos >
- Financial Data Visualization Overlay on Tower Silhouette
Financial Data Visualization Overlay on Tower Silhouette Video
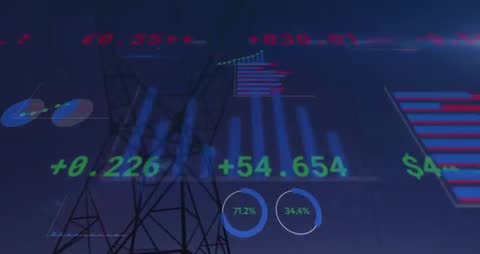
This illustration combines financial data visualization with infrastructure elements, presenting rising financial trends overlayed on a towering silhouette. It symbolizes the integration of technology and infrastructure within the financial and analytics sectors. Ideal for presentations on finance technology, analytics dashboards, business growth strategies, and digital finance insights. Perfect for use in industries focused on merging financial models with industrial elements or creating connections between old and new technology worlds.
Powered by 


downloads
Tags:
More
Credit Photo
If you would like to credit the Photo, here are some ways you can do so
Text Link
video Link
<span class="text-link">
<span>
<a target="_blank" href=https://pikwizard.com/video/financial-data-visualization-overlay-on-tower-silhouette/2b6bdef800286503485e07b0dd2c5061/>PikWizard</a>
</span>
</span>
<span class="image-link">
<span
style="margin: 0 0 20px 0; display: inline-block; vertical-align: middle; width: 100%;"
>
<a
target="_blank"
href="https://pikwizard.com/video/financial-data-visualization-overlay-on-tower-silhouette/2b6bdef800286503485e07b0dd2c5061/"
style="text-decoration: none; font-size: 10px; margin: 0;"
>
<video controls style="width: 100%; margin: 0;">
<source src="https://player.vimeo.com/progressive_redirect/playback/1100663955/rendition/540p/file.mp4?loc=external&oauth2_token_id=1223210874&signature=db57d83fb444e3400ec6274a69038e4e05e04eee3b336adfd6cc7899bed184d6" type="video/mp4"
poster="https://pikwizard.com/pw/medium/2b6bdef800286503485e07b0dd2c5061.jpg"/>
Your browser does not support the video tag.
</video>
<p style="font-size: 12px; margin: 0;">PikWizard</p>
</a>
</span>
</span>
Free (free of charge)
Free for personal and commercial use.
Author: Awesome Content