
- Home >
- Stock Videos >
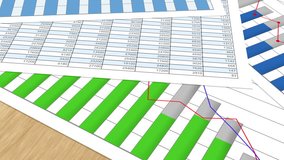
- Financial Data Visualization Overlay on Workers in Industry
Financial Data Visualization Overlay on Workers in Industry Video

Digital animation depicts financial statistics layered over workers in an industrial environment, conveying themes of industry analysis, business forecasts, and enterprise logistics. Ideal for use in business presentations, tutorials on data analytics, or visual storytelling surrounding economic trends and developments.
Powered by  - Get 15% off with code: PIKWIZARD15


downloads
Tags:
More
Credit Photo
If you would like to credit the Photo, here are some ways you can do so
Text Link
video Link
<span class="text-link">
<span>
<a target="_blank" href=https://pikwizard.com/video/financial-data-visualization-overlay-on-workers-in-industry/542b78bee2ade747d2ecf643a9e0137e/>PikWizard</a>
</span>
</span>
<span class="image-link">
<span
style="margin: 0 0 20px 0; display: inline-block; vertical-align: middle; width: 100%;"
>
<a
target="_blank"
href="https://pikwizard.com/video/financial-data-visualization-overlay-on-workers-in-industry/542b78bee2ade747d2ecf643a9e0137e/"
style="text-decoration: none; font-size: 10px; margin: 0;"
>
<video controls style="width: 100%; margin: 0;">
<source src="https://player.vimeo.com/progressive_redirect/playback/911718807/rendition/240p/file.mp4?loc=external&oauth2_token_id=1223210874&signature=f556fcc43526b1d0d56999b536b505f81abfae381a28fffd4e87db850a526f5c" type="video/mp4"
poster="https://pikwizard.com/pw/medium/542b78bee2ade747d2ecf643a9e0137e.jpg"/>
Your browser does not support the video tag.
</video>
<p style="font-size: 12px; margin: 0;">PikWizard</p>
</a>
</span>
</span>
Free (free of charge)
Free for personal and commercial use.
Author: Awesome Content