
- Home >
- Stock Videos >
- Financial Data Visualization with Dynamic Graphs
Financial Data Visualization with Dynamic Graphs Video
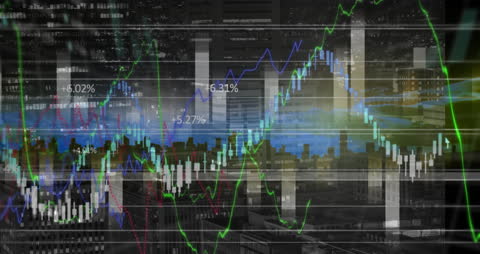
A dynamic visual representation of financial data superimposed on a background of an office environment. The animation showcases fluctuating graphs illustrating percent changes alongside abstract line charts, conveying concepts of market trends and economic analysis. Ideal for use in presentations, financial blog posts, or educational materials about finance technology, data management, or investment strategies.

downloads
Tags:
More
Credit Photo
If you would like to credit the Photo, here are some ways you can do so
Text Link
video Link
<span class="text-link">
<span>
<a target="_blank" href=https://pikwizard.com/video/financial-data-visualization-with-dynamic-graphs/0dc635a742d895242e21a9c2dc7fe4e3/>PikWizard</a>
</span>
</span>
<span class="image-link">
<span
style="margin: 0 0 20px 0; display: inline-block; vertical-align: middle; width: 100%;"
>
<a
target="_blank"
href="https://pikwizard.com/video/financial-data-visualization-with-dynamic-graphs/0dc635a742d895242e21a9c2dc7fe4e3/"
style="text-decoration: none; font-size: 10px; margin: 0;"
>
<video controls style="width: 100%; margin: 0;">
<source src="https://player.vimeo.com/progressive_redirect/playback/735001518/rendition/240p/file.mp4?loc=external&oauth2_token_id=1223210874&signature=2622576cb4e4a921771ccb368cd5bd777661f3e60325c15fa900162b13aca115" type="video/mp4"
poster="https://pikwizard.com/pw/medium/0dc635a742d895242e21a9c2dc7fe4e3.jpg"/>
Your browser does not support the video tag.
</video>
<p style="font-size: 12px; margin: 0;">PikWizard</p>
</a>
</span>
</span>
Free (free of charge)
Free for personal and commercial use.
Author: Awesome Content