
- Home >
- Stock Videos >
- Financial Data Visualization with Glowing Digital Display
Financial Data Visualization with Glowing Digital Display Video
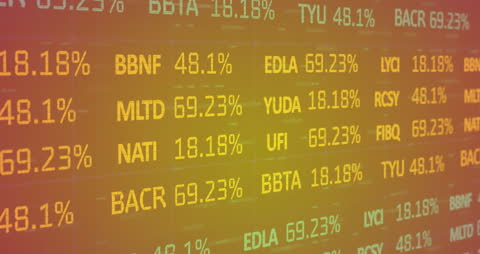
This vibrant graphic of stock information and percentages appears on a digital display, depicting the flux and intricacies of financial markets. Useful for resources covering finance, data analytics, and digital technology innovation, it illustrates data-driven insights in the global business world.

downloads
Tags:
More
Credit Photo
If you would like to credit the Photo, here are some ways you can do so
Text Link
video Link
<span class="text-link">
<span>
<a target="_blank" href=https://pikwizard.com/video/financial-data-visualization-with-glowing-digital-display/8a4a786efafed1ef889103e4007b2946/>PikWizard</a>
</span>
</span>
<span class="image-link">
<span
style="margin: 0 0 20px 0; display: inline-block; vertical-align: middle; width: 100%;"
>
<a
target="_blank"
href="https://pikwizard.com/video/financial-data-visualization-with-glowing-digital-display/8a4a786efafed1ef889103e4007b2946/"
style="text-decoration: none; font-size: 10px; margin: 0;"
>
<video controls style="width: 100%; margin: 0;">
<source src="https://player.vimeo.com/progressive_redirect/playback/901430350/rendition/240p/file.mp4?loc=external&oauth2_token_id=1223210874&signature=ea14672a29f8b2a83d5ac7715821d456a9981e5201fffee6b53911131c88ba64" type="video/mp4"
poster="https://pikwizard.com/pw/medium/8a4a786efafed1ef889103e4007b2946.jpg"/>
Your browser does not support the video tag.
</video>
<p style="font-size: 12px; margin: 0;">PikWizard</p>
</a>
</span>
</span>
Free (free of charge)
Free for personal and commercial use.
Author: Awesome Content