
- Home >
- Stock Videos >
- Financial Data Visualization with Renewable Energy Elements
Financial Data Visualization with Renewable Energy Elements Video
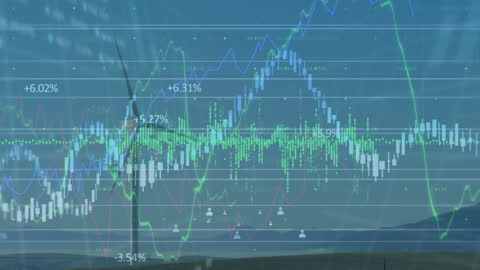
This visualization showcases complex financial data and stock market trends overlaid with elements representing renewable energy, such as wind turbines. It highlights the fusion of technology with sustainable energy solutions. Useful for illustrating financial articles, presentations on economic growth and investment in sustainable resources, or educational materials focusing on renewable energy technologies.
Powered by 


downloads
Tags:
More
Credit Photo
If you would like to credit the Photo, here are some ways you can do so
Text Link
video Link
<span class="text-link">
<span>
<a target="_blank" href=https://pikwizard.com/video/financial-data-visualization-with-renewable-energy-elements/0fa3be1877474a1d319d20ff92d7aa01/>PikWizard</a>
</span>
</span>
<span class="image-link">
<span
style="margin: 0 0 20px 0; display: inline-block; vertical-align: middle; width: 100%;"
>
<a
target="_blank"
href="https://pikwizard.com/video/financial-data-visualization-with-renewable-energy-elements/0fa3be1877474a1d319d20ff92d7aa01/"
style="text-decoration: none; font-size: 10px; margin: 0;"
>
<video controls style="width: 100%; margin: 0;">
<source src="https://player.vimeo.com/progressive_redirect/playback/760128796/rendition/240p/file.mp4?loc=external&oauth2_token_id=1223210874&signature=4e5a36744a111fa39835b50b96eb7a361774bc3be4cdead8fd98a2a079033ec3" type="video/mp4"
poster="https://pikwizard.com/pw/medium/0fa3be1877474a1d319d20ff92d7aa01.jpg"/>
Your browser does not support the video tag.
</video>
<p style="font-size: 12px; margin: 0;">PikWizard</p>
</a>
</span>
</span>
Free (free of charge)
Free for personal and commercial use.
Author: Awesome Content