
- Home >
- Stock Videos >
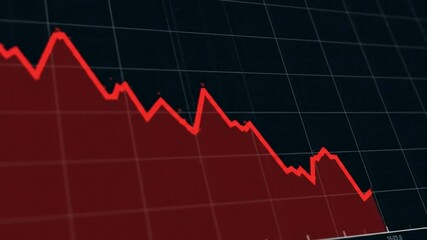
- Financial Data Visualization with Stock Codes and Trends
Financial Data Visualization with Stock Codes and Trends Video
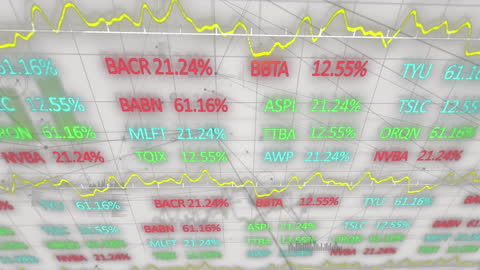
Text displaying various stock codes and percentages against a dynamic graph showcasing market trends. This visual representation is ideal for use in business presentations, financial analysis reports, and tutorials on stock market trading, simplifying the concepts of fluctuating stock values and trends in a compelling digital format.
Powered by 


downloads
Tags:
More
Credit Photo
If you would like to credit the Photo, here are some ways you can do so
Text Link
video Link
<span class="text-link">
<span>
<a target="_blank" href=https://pikwizard.com/video/financial-data-visualization-with-stock-codes-and-trends/a156ca83235b24966f540c87623264fa/>PikWizard</a>
</span>
</span>
<span class="image-link">
<span
style="margin: 0 0 20px 0; display: inline-block; vertical-align: middle; width: 100%;"
>
<a
target="_blank"
href="https://pikwizard.com/video/financial-data-visualization-with-stock-codes-and-trends/a156ca83235b24966f540c87623264fa/"
style="text-decoration: none; font-size: 10px; margin: 0;"
>
<video controls style="width: 100%; margin: 0;">
<source src="https://player.vimeo.com/progressive_redirect/playback/759669975/rendition/240p/file.mp4?loc=external&oauth2_token_id=1223210874&signature=84cd171cf22779a29773e6e13937f950b1251025491c12358b71cb1436de1e38" type="video/mp4"
poster="https://pikwizard.com/pw/medium/a156ca83235b24966f540c87623264fa.jpg"/>
Your browser does not support the video tag.
</video>
<p style="font-size: 12px; margin: 0;">PikWizard</p>
</a>
</span>
</span>
Free (free of charge)
Free for personal and commercial use.
Author: Awesome Content