
- Home >
- Stock Videos >
- Financial Data Visualizations on Digital Display
Financial Data Visualizations on Digital Display Video
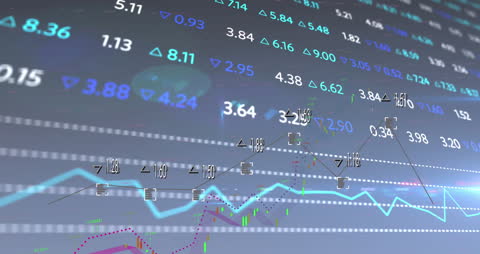
This abstract representation of stock market data against a blue background is ideal for presentations about global finance, economic trends, and investment strategies. The floating numbers and graphs convey insights into a complex financial system, useful for educational materials and business reports.
Powered by  - Get 15% off with code: PIKWIZARD15


downloads
Tags:
More
Credit Photo
If you would like to credit the Photo, here are some ways you can do so
Text Link
video Link
<span class="text-link">
<span>
<a target="_blank" href=https://pikwizard.com/video/financial-data-visualizations-on-digital-display/5428daeafddce3c22bb06693d4bc88e5/>PikWizard</a>
</span>
</span>
<span class="image-link">
<span
style="margin: 0 0 20px 0; display: inline-block; vertical-align: middle; width: 100%;"
>
<a
target="_blank"
href="https://pikwizard.com/video/financial-data-visualizations-on-digital-display/5428daeafddce3c22bb06693d4bc88e5/"
style="text-decoration: none; font-size: 10px; margin: 0;"
>
<video controls style="width: 100%; margin: 0;">
<source src="https://player.vimeo.com/progressive_redirect/playback/908417434/rendition/240p/file.mp4?loc=external&oauth2_token_id=1223210874&signature=b52507939482f92dedb6ed45ee07c512beebe1ef43940c246bf4ba801c2bbbc7" type="video/mp4"
poster="https://pikwizard.com/pw/medium/5428daeafddce3c22bb06693d4bc88e5.jpg"/>
Your browser does not support the video tag.
</video>
<p style="font-size: 12px; margin: 0;">PikWizard</p>
</a>
</span>
</span>
Free (free of charge)
Free for personal and commercial use.
Author: Awesome Content