
- Home >
- Stock Videos >
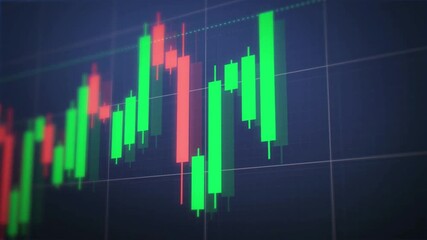
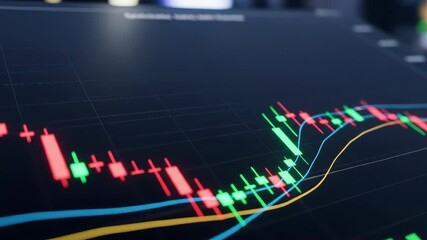
- Financial Data with Candlestick Chart Overlay
Financial Data with Candlestick Chart Overlay Video

Visualization captures the dynamic analysis of financial data with candlestick chart elements overlaid on a grid. This reflects trends, market fluctuations, and the complexity of economic activities. Useful for representing investment strategies, financial reports, economic forecasts, and data analysis presentations.
Powered by 


downloads
Tags:
More
Credit Photo
If you would like to credit the Photo, here are some ways you can do so
Text Link
video Link
<span class="text-link">
<span>
<a target="_blank" href=https://pikwizard.com/video/financial-data-with-candlestick-chart-overlay/4888bcbdab9c0fd3e7be352241dc808e/>PikWizard</a>
</span>
</span>
<span class="image-link">
<span
style="margin: 0 0 20px 0; display: inline-block; vertical-align: middle; width: 100%;"
>
<a
target="_blank"
href="https://pikwizard.com/video/financial-data-with-candlestick-chart-overlay/4888bcbdab9c0fd3e7be352241dc808e/"
style="text-decoration: none; font-size: 10px; margin: 0;"
>
<video controls style="width: 100%; margin: 0;">
<source src="https://player.vimeo.com/progressive_redirect/playback/838921845/rendition/240p/file.mp4?loc=external&oauth2_token_id=1223210874&signature=972418e40dab40c74cf2099cb711799433883645f447ddd69e8cc9e9594e481d" type="video/mp4"
poster="https://pikwizard.com/pw/medium/4888bcbdab9c0fd3e7be352241dc808e.jpg"/>
Your browser does not support the video tag.
</video>
<p style="font-size: 12px; margin: 0;">PikWizard</p>
</a>
</span>
</span>
Free (free of charge)
Free for personal and commercial use.
Author: Awesome Content