
- Home >
- Stock Videos >
- Financial Graph with Graphs and Figures
Financial Graph with Graphs and Figures Video
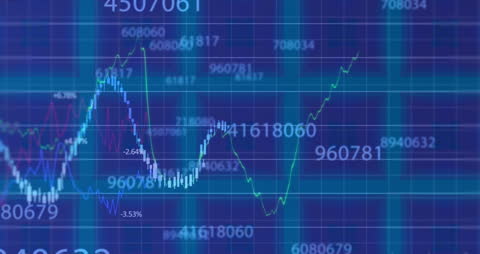
Futuristic representation of stock market data with numbers and line graph movements depicted on blue background. Ideal for use in presentations about economic trends, financial market analysis, trading strategies, or technological advancements in finance.
Powered by 


downloads
Tags:
More
Credit Photo
If you would like to credit the Photo, here are some ways you can do so
Text Link
video Link
<span class="text-link">
<span>
<a target="_blank" href=https://pikwizard.com/video/financial-graph-with-graphs-and-figures/2a7fa801305c0cc5f973b7a26033a09c/>PikWizard</a>
</span>
</span>
<span class="image-link">
<span
style="margin: 0 0 20px 0; display: inline-block; vertical-align: middle; width: 100%;"
>
<a
target="_blank"
href="https://pikwizard.com/video/financial-graph-with-graphs-and-figures/2a7fa801305c0cc5f973b7a26033a09c/"
style="text-decoration: none; font-size: 10px; margin: 0;"
>
<video controls style="width: 100%; margin: 0;">
<source src="https://player.vimeo.com/progressive_redirect/playback/717709095/rendition/240p/file.mp4?loc=external&oauth2_token_id=1223210874&signature=1a9a9bfb9c3196c96eb40e834d56d0701a5b5a17c2edeb330787498a90ba1a9c" type="video/mp4"
poster="https://pikwizard.com/pw/medium/2a7fa801305c0cc5f973b7a26033a09c.jpg"/>
Your browser does not support the video tag.
</video>
<p style="font-size: 12px; margin: 0;">PikWizard</p>
</a>
</span>
</span>
Free (free of charge)
Free for personal and commercial use.
Author: Awesome Content