
- Home >
- Stock Videos >
- Financial Graphs and Data Analytics in Warehouse Setting
Financial Graphs and Data Analytics in Warehouse Setting Video
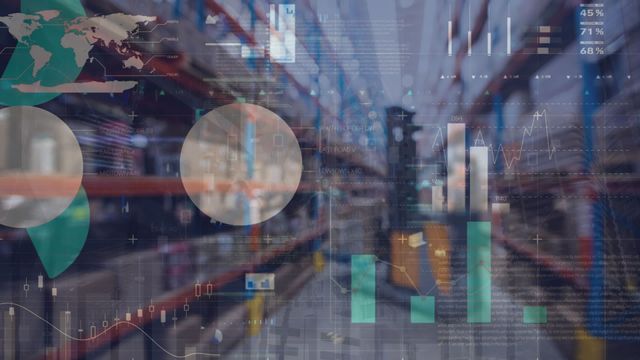
This video depicts a high-tech visual with financial graphs and data analytics superimposed over a warehouse background, symbolizing the integration of business intelligence in logistics management. It can be used to represent modern supply chain processes, economic data analysis, and the digital transformation of traditional warehouse management. Ideal for use in presentations, articles, or websites related to business investment, supply chain innovation, or technology-driven solutions in logistics.
Powered by 


downloads
Tags:
More
Credit Photo
If you would like to credit the Photo, here are some ways you can do so
Text Link
video Link
<span class="text-link">
<span>
<a target="_blank" href=https://pikwizard.com/video/financial-graphs-and-data-analytics-in-warehouse-setting/4db212e4a27e1478ebd885d31a3ecf19/>PikWizard</a>
</span>
</span>
<span class="image-link">
<span
style="margin: 0 0 20px 0; display: inline-block; vertical-align: middle; width: 100%;"
>
<a
target="_blank"
href="https://pikwizard.com/video/financial-graphs-and-data-analytics-in-warehouse-setting/4db212e4a27e1478ebd885d31a3ecf19/"
style="text-decoration: none; font-size: 10px; margin: 0;"
>
<video controls style="width: 100%; margin: 0;">
<source src="https://player.vimeo.com/progressive_redirect/playback/719899995/rendition/240p/file.mp4?loc=external&oauth2_token_id=1223210874&signature=4225711b70bfc4f76f6b6e29bfea060590f94db713ce54c55c7941efdc893d49" type="video/mp4"
poster="https://pikwizard.com/pw/medium/4db212e4a27e1478ebd885d31a3ecf19.jpg"/>
Your browser does not support the video tag.
</video>
<p style="font-size: 12px; margin: 0;">PikWizard</p>
</a>
</span>
</span>
Free (free of charge)
Free for personal and commercial use.
Author: Awesome Content