
- Home >
- Stock Videos >
- Financial Graphs Overlaying Vision Test Interface
Financial Graphs Overlaying Vision Test Interface Video
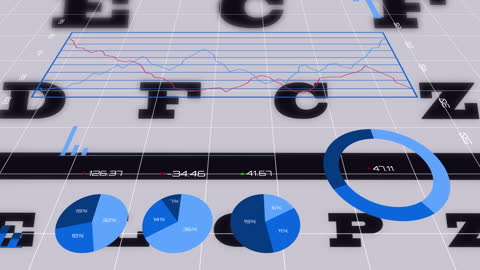
This video shows financial graphs and data processing elements superimposed on an interface that resembles an eyesight test. Ideal for topics related to finance, data analysis, business intelligence, medical services, and digital vision technology. It can be used in presentations or articles discussing the merging of digital technology with medical diagnostics.

downloads
Tags:
More
Credit Photo
If you would like to credit the Photo, here are some ways you can do so
Text Link
video Link
<span class="text-link">
<span>
<a target="_blank" href=https://pikwizard.com/video/financial-graphs-overlaying-vision-test-interface/f75f22f5cc31acf2edecc844a8e9cb66/>PikWizard</a>
</span>
</span>
<span class="image-link">
<span
style="margin: 0 0 20px 0; display: inline-block; vertical-align: middle; width: 100%;"
>
<a
target="_blank"
href="https://pikwizard.com/video/financial-graphs-overlaying-vision-test-interface/f75f22f5cc31acf2edecc844a8e9cb66/"
style="text-decoration: none; font-size: 10px; margin: 0;"
>
<video controls style="width: 100%; margin: 0;">
<source src="https://player.vimeo.com/progressive_redirect/playback/752626772/rendition/240p/file.mp4?loc=external&oauth2_token_id=1223210874&signature=16768ce092bbf2b9d0e708644e4a14ece61d1a3883b3214fa9b6e8d7a035bef6" type="video/mp4"
poster="https://pikwizard.com/pw/medium/f75f22f5cc31acf2edecc844a8e9cb66.jpg"/>
Your browser does not support the video tag.
</video>
<p style="font-size: 12px; margin: 0;">PikWizard</p>
</a>
</span>
</span>
Free (free of charge)
Free for personal and commercial use.
Author: Awesome Content