
- Home >
- Stock Videos >
- Financial Market Data Visualization with World Map Overlay
Financial Market Data Visualization with World Map Overlay Video
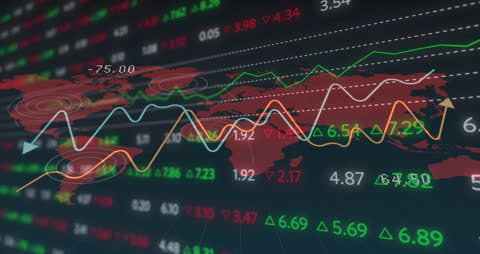
Graphic depicting dynamic stock market trends and analytics overlays on a world map. Useful for presentations or articles related to global economy and financial technology advancements.
Powered by  - Get 15% off with code: PIKWIZARD15


downloads
Tags:
More
Credit Photo
If you would like to credit the Photo, here are some ways you can do so
Text Link
video Link
<span class="text-link">
<span>
<a target="_blank" href=https://pikwizard.com/video/financial-market-data-visualization-with-world-map-overlay/c5779d94a734d3cd9142020f62053b59/>PikWizard</a>
</span>
</span>
<span class="image-link">
<span
style="margin: 0 0 20px 0; display: inline-block; vertical-align: middle; width: 100%;"
>
<a
target="_blank"
href="https://pikwizard.com/video/financial-market-data-visualization-with-world-map-overlay/c5779d94a734d3cd9142020f62053b59/"
style="text-decoration: none; font-size: 10px; margin: 0;"
>
<video controls style="width: 100%; margin: 0;">
<source src="https://player.vimeo.com/progressive_redirect/playback/790519637/rendition/240p/file.mp4?loc=external&oauth2_token_id=1223210874&signature=71dd30222f233c8a90a3944c67dfe84dee2df903e5b0ade4202c7fdcf9b5f6a1" type="video/mp4"
poster="https://pikwizard.com/pw/medium/c5779d94a734d3cd9142020f62053b59.jpg"/>
Your browser does not support the video tag.
</video>
<p style="font-size: 12px; margin: 0;">PikWizard</p>
</a>
</span>
</span>
Free (free of charge)
Free for personal and commercial use.
Author: Awesome Content