
- Home >
- Stock Videos >
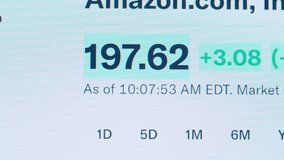
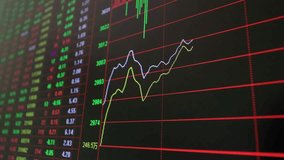
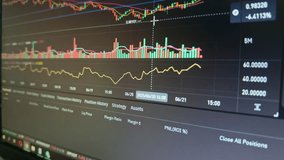
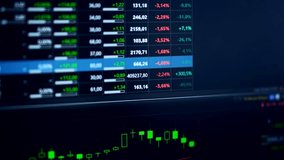
- Financial Stock Market Display with Dynamic Data Changes
Financial Stock Market Display with Dynamic Data Changes Video
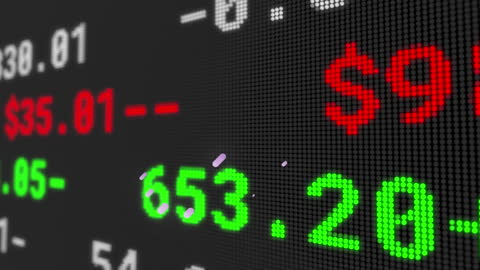
Vibrant depiction of changing financial data with colorful numbers displayed highlighting gains and losses. Useful for presentations on economic reports, financial market analysis, investment strategies, or educational materials related to finance and trading.
Powered by  - Get 15% off with code: PIKWIZARD15


downloads
Tags:
More
Credit Photo
If you would like to credit the Photo, here are some ways you can do so
Text Link
video Link
<span class="text-link">
<span>
<a target="_blank" href=https://pikwizard.com/video/financial-stock-market-display-with-dynamic-data-changes/6f7dbb5961c472c2e6a4d3e4f2562f90/>PikWizard</a>
</span>
</span>
<span class="image-link">
<span
style="margin: 0 0 20px 0; display: inline-block; vertical-align: middle; width: 100%;"
>
<a
target="_blank"
href="https://pikwizard.com/video/financial-stock-market-display-with-dynamic-data-changes/6f7dbb5961c472c2e6a4d3e4f2562f90/"
style="text-decoration: none; font-size: 10px; margin: 0;"
>
<video controls style="width: 100%; margin: 0;">
<source src="https://player.vimeo.com/progressive_redirect/playback/774034282/rendition/240p/file.mp4?loc=external&oauth2_token_id=1223210874&signature=2817bb5af2c0c367d5a1685290dd3e84c849cd7254c4f8191312e3eed21be9ae" type="video/mp4"
poster="https://pikwizard.com/pw/medium/6f7dbb5961c472c2e6a4d3e4f2562f90.jpg"/>
Your browser does not support the video tag.
</video>
<p style="font-size: 12px; margin: 0;">PikWizard</p>
</a>
</span>
</span>
Free (free of charge)
Free for personal and commercial use.
Author: Awesome Content