
- Home >
- Stock Videos >
- Fire Effects Overlay with Dynamic Financial Stock Data Economics Concept
Fire Effects Overlay with Dynamic Financial Stock Data Economics Concept Video
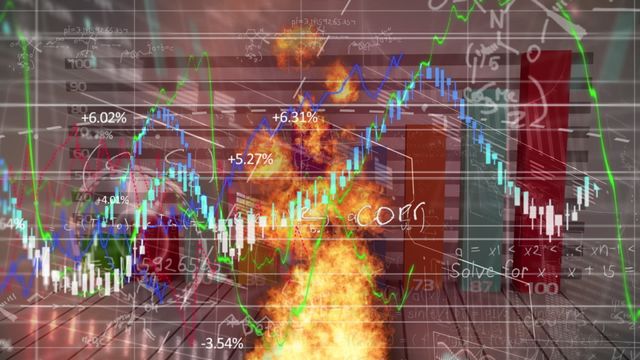
Find a dynamic representation of financial market volatility with this video combining lively fire effects and financial data graphs, symbolizing market crises or heated trading days. With its vivid colors and detailed analytics display, it suits articles discussing financial difficulties, stock evaluations, market trends, or economic predictions in a dramatic flair.
Powered by 


7
downloads
downloads
Tags:
More
Credit Photo
If you would like to credit the Photo, here are some ways you can do so
Text Link
video Link
<span class="text-link">
<span>
<a target="_blank" href=https://pikwizard.com/video/fire-effects-overlay-with-dynamic-financial-stock-data-economics-concept/6c945f685648e46b491783cbf26258dc/>PikWizard</a>
</span>
</span>
<span class="image-link">
<span
style="margin: 0 0 20px 0; display: inline-block; vertical-align: middle; width: 100%;"
>
<a
target="_blank"
href="https://pikwizard.com/video/fire-effects-overlay-with-dynamic-financial-stock-data-economics-concept/6c945f685648e46b491783cbf26258dc/"
style="text-decoration: none; font-size: 10px; margin: 0;"
>
<video controls style="width: 100%; margin: 0;">
<source src="https://player.vimeo.com/progressive_redirect/playback/790399607/rendition/240p/file.mp4?loc=external&oauth2_token_id=1223210874&signature=8faf7ea75c5d5fa94a7180daaf1a983ffc702d70e018221436657d24a9b20699" type="video/mp4"
poster="https://pikwizard.com/pw/medium/6c945f685648e46b491783cbf26258dc.jpg"/>
Your browser does not support the video tag.
</video>
<p style="font-size: 12px; margin: 0;">PikWizard</p>
</a>
</span>
</span>
Free (free of charge)
Free for personal and commercial use.
Author: Awesome Content