
- Home >
- Stock Videos >
- Futuristic Analytics Line Graph Floating Numeric Tags
Futuristic Analytics Line Graph Floating Numeric Tags Video
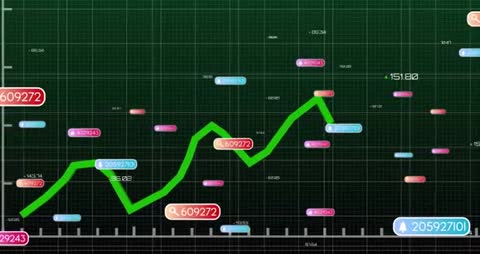
This video represents a futuristic digital analytics dashboard focusing on financial or data analysis concepts. The neon green line against a dark grid background presents a captivating visual of statistical movements with floating numeric tags, each featuring unique icons. Ideal for use in presentations, websites, or advertisements related to data science, financial analysis, technology monitoring, or virtual dashboard interfaces.

downloads
Tags:
More
Credit Photo
If you would like to credit the Photo, here are some ways you can do so
Text Link
video Link
<span class="text-link">
<span>
<a target="_blank" href=https://pikwizard.com/video/futuristic-analytics-line-graph-floating-numeric-tags/13ee91bd83712d455e1a8a1a9877e8cf/>PikWizard</a>
</span>
</span>
<span class="image-link">
<span
style="margin: 0 0 20px 0; display: inline-block; vertical-align: middle; width: 100%;"
>
<a
target="_blank"
href="https://pikwizard.com/video/futuristic-analytics-line-graph-floating-numeric-tags/13ee91bd83712d455e1a8a1a9877e8cf/"
style="text-decoration: none; font-size: 10px; margin: 0;"
>
<video controls style="width: 100%; margin: 0;">
<source src="https://player.vimeo.com/progressive_redirect/playback/1078029502/rendition/240p/file.mp4?loc=external&oauth2_token_id=1223210874&signature=e04a7c16084b0b91ff1cb787a1b4d01389753e34e0e0d57f6285bef9972c4530" type="video/mp4"
poster="https://pikwizard.com/pw/medium/13ee91bd83712d455e1a8a1a9877e8cf.jpg"/>
Your browser does not support the video tag.
</video>
<p style="font-size: 12px; margin: 0;">PikWizard</p>
</a>
</span>
</span>
Free (free of charge)
Free for personal and commercial use.
Author: Awesome Content