
- Home >
- Stock Videos >
- Futuristic Chart Display with Digital Stock Index Visualization
Futuristic Chart Display with Digital Stock Index Visualization Video
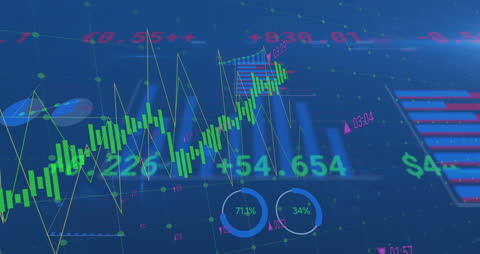
Imagery portrays a sophisticated digital rendering of stock market analytics with prominent graphs and numeric data credits overlay, suitable for illustrating concepts of financial technology, market analysis, or forward-looking investment presentations. Ideal for enhancing reports, financial blogs, or use in presentations on cutting-edge technological themes in finance.
Powered by  - Get 15% off with code: PIKWIZARD15


downloads
Tags:
More
Credit Photo
If you would like to credit the Photo, here are some ways you can do so
Text Link
video Link
<span class="text-link">
<span>
<a target="_blank" href=https://pikwizard.com/video/futuristic-chart-display-with-digital-stock-index-visualization/1101a119094d14334b6a09072fc7c030/>PikWizard</a>
</span>
</span>
<span class="image-link">
<span
style="margin: 0 0 20px 0; display: inline-block; vertical-align: middle; width: 100%;"
>
<a
target="_blank"
href="https://pikwizard.com/video/futuristic-chart-display-with-digital-stock-index-visualization/1101a119094d14334b6a09072fc7c030/"
style="text-decoration: none; font-size: 10px; margin: 0;"
>
<video controls style="width: 100%; margin: 0;">
<source src="https://player.vimeo.com/progressive_redirect/playback/741051722/rendition/240p/file.mp4?loc=external&oauth2_token_id=1223210874&signature=0cf1b4359ae3fb2a5bc4fd83a08725b4c7bb2d1decaace90a50aa99a6799c037" type="video/mp4"
poster="https://pikwizard.com/pw/medium/1101a119094d14334b6a09072fc7c030.jpg"/>
Your browser does not support the video tag.
</video>
<p style="font-size: 12px; margin: 0;">PikWizard</p>
</a>
</span>
</span>
Free (free of charge)
Free for personal and commercial use.
Author: Awesome Content