
- Home >
- Stock Videos >
- Futuristic Dashboard Interface with Digital Charts and Graphs
Futuristic Dashboard Interface with Digital Charts and Graphs Video
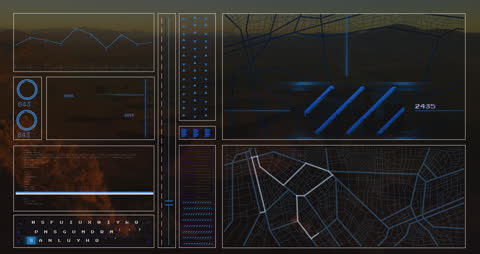
Dynamic visualization of financial data through intuitive user interface. Features multicolored graphs, interactive displays, and map graphics. Useful for presentations, demonstrating technological proficiency, or enhancing visual metaphors in business and finance promotions.

downloads
Tags:
More
Credit Photo
If you would like to credit the Photo, here are some ways you can do so
Text Link
video Link
<span class="text-link">
<span>
<a target="_blank" href=https://pikwizard.com/video/futuristic-dashboard-interface-with-digital-charts-and-graphs/a6a199483316ea6255a2d9c54d122346/>PikWizard</a>
</span>
</span>
<span class="image-link">
<span
style="margin: 0 0 20px 0; display: inline-block; vertical-align: middle; width: 100%;"
>
<a
target="_blank"
href="https://pikwizard.com/video/futuristic-dashboard-interface-with-digital-charts-and-graphs/a6a199483316ea6255a2d9c54d122346/"
style="text-decoration: none; font-size: 10px; margin: 0;"
>
<video controls style="width: 100%; margin: 0;">
<source src="https://player.vimeo.com/progressive_redirect/playback/820876109/rendition/240p/file.mp4?loc=external&oauth2_token_id=1223210874&signature=9184da9fc6619d5c14ea381f5b5a5602949694b1265fce5a32c9725e3da1a184" type="video/mp4"
poster="https://pikwizard.com/pw/medium/a6a199483316ea6255a2d9c54d122346.jpg"/>
Your browser does not support the video tag.
</video>
<p style="font-size: 12px; margin: 0;">PikWizard</p>
</a>
</span>
</span>
Free (free of charge)
Free for personal and commercial use.
Author: Awesome Content