
- Home >
- Stock Videos >
- Futuristic Dashboard with Charts and Analytics Interface
Futuristic Dashboard with Charts and Analytics Interface Video

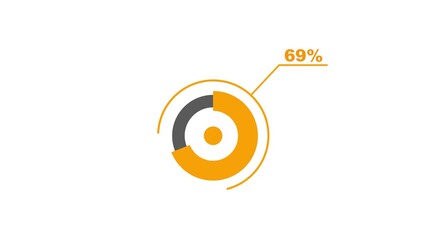
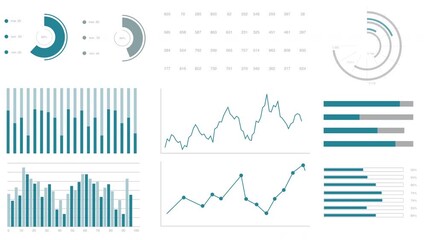
This depiction of a futuristic dashboard includes dynamic bar and line charts, as well as probability distributions represented through pie charts. Designed in a sleek digital interface, a world map outlines regional data engagements, reflecting global analytics while incorporating user interaction metrics signified by notifications and bubble rising effects. Suitable for digital technology Ui frameworks, presentations on data science insights, or promoting analytics tools needing an innovative and engaging visual component.
Powered by 


downloads
Tags:
More
Credit Photo
If you would like to credit the Photo, here are some ways you can do so
Text Link
video Link
<span class="text-link">
<span>
<a target="_blank" href=https://pikwizard.com/video/futuristic-dashboard-with-charts-and-analytics-interface/d58ebe794d0b927c9562cd927d15c1bf/>PikWizard</a>
</span>
</span>
<span class="image-link">
<span
style="margin: 0 0 20px 0; display: inline-block; vertical-align: middle; width: 100%;"
>
<a
target="_blank"
href="https://pikwizard.com/video/futuristic-dashboard-with-charts-and-analytics-interface/d58ebe794d0b927c9562cd927d15c1bf/"
style="text-decoration: none; font-size: 10px; margin: 0;"
>
<video controls style="width: 100%; margin: 0;">
<source src="https://player.vimeo.com/progressive_redirect/playback/1094771750/rendition/240p/file.mp4?loc=external&oauth2_token_id=1223210874&signature=d6c50e3689bc2cb2ddbf3caefbd65d9a960f346f97b3ab6422739d229741f4dd" type="video/mp4"
poster="https://pikwizard.com/pw/medium/d58ebe794d0b927c9562cd927d15c1bf.jpg"/>
Your browser does not support the video tag.
</video>
<p style="font-size: 12px; margin: 0;">PikWizard</p>
</a>
</span>
</span>
Free (free of charge)
Free for personal and commercial use.
Author: Awesome Content