
- Home >
- Stock Videos >
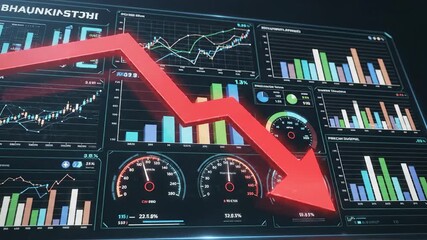
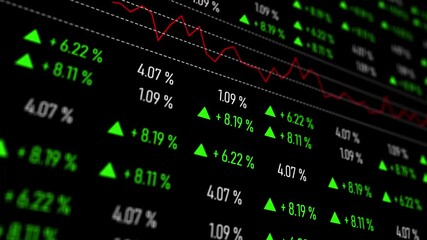
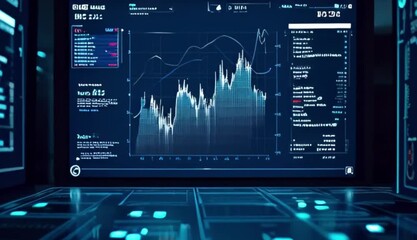
- Futuristic Data Analysis with Arrows and Virtual Interfaces
Futuristic Data Analysis with Arrows and Virtual Interfaces Video

Digital background depicting dynamic graphs and charts conveys concept of monitoring financial markets. Suitable for presentations, technology blogs, financial analysis, business reports, or educational contexts preferring modern themes.
Powered by 


downloads
Tags:
More
Credit Photo
If you would like to credit the Photo, here are some ways you can do so
Text Link
video Link
<span class="text-link">
<span>
<a target="_blank" href=https://pikwizard.com/video/futuristic-data-analysis-with-arrows-and-virtual-interfaces/51c932da46c86a0e9d0179a8cfdfa136/>PikWizard</a>
</span>
</span>
<span class="image-link">
<span
style="margin: 0 0 20px 0; display: inline-block; vertical-align: middle; width: 100%;"
>
<a
target="_blank"
href="https://pikwizard.com/video/futuristic-data-analysis-with-arrows-and-virtual-interfaces/51c932da46c86a0e9d0179a8cfdfa136/"
style="text-decoration: none; font-size: 10px; margin: 0;"
>
<video controls style="width: 100%; margin: 0;">
<source src="https://player.vimeo.com/progressive_redirect/playback/790155879/rendition/240p/file.mp4?loc=external&oauth2_token_id=1223210874&signature=873d31f019fe18252d1f51a9bf72c5d5505321a2e90a9f0c6a8ed9899485b15b" type="video/mp4"
poster="https://pikwizard.com/pw/medium/51c932da46c86a0e9d0179a8cfdfa136.jpg"/>
Your browser does not support the video tag.
</video>
<p style="font-size: 12px; margin: 0;">PikWizard</p>
</a>
</span>
</span>
Free (free of charge)
Free for personal and commercial use.
Author: Awesome Content