
- Home >
- Stock Videos >
- Futuristic Data Analysis with Bar Graph on Digital Interface
Futuristic Data Analysis with Bar Graph on Digital Interface Video
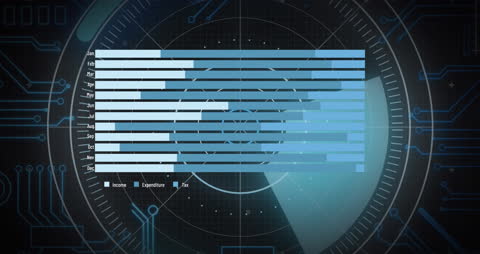
Bar graph set against a dark, sleek digital interface, representing financial data across months. Highlights income, expenditure, and tax in a visually compelling manner with a geometric digital background. Ideal for presentations on financial forecasting, technological sectors, or data-driven analytics in modern business environments.
Powered by  - Get 15% off with code: PIKWIZARD15


downloads
Tags:
More
Credit Photo
If you would like to credit the Photo, here are some ways you can do so
Text Link
video Link
<span class="text-link">
<span>
<a target="_blank" href=https://pikwizard.com/video/futuristic-data-analysis-with-bar-graph-on-digital-interface/c7e1bf1cafb5189f170474723f3a3039/>PikWizard</a>
</span>
</span>
<span class="image-link">
<span
style="margin: 0 0 20px 0; display: inline-block; vertical-align: middle; width: 100%;"
>
<a
target="_blank"
href="https://pikwizard.com/video/futuristic-data-analysis-with-bar-graph-on-digital-interface/c7e1bf1cafb5189f170474723f3a3039/"
style="text-decoration: none; font-size: 10px; margin: 0;"
>
<video controls style="width: 100%; margin: 0;">
<source src="https://player.vimeo.com/progressive_redirect/playback/756024993/rendition/240p/file.mp4?loc=external&oauth2_token_id=1223210874&signature=b7b5853dd6add21e7f92c2fc9d952cec48db9d340360734705413495ee0ec979" type="video/mp4"
poster="https://pikwizard.com/pw/medium/c7e1bf1cafb5189f170474723f3a3039.jpg"/>
Your browser does not support the video tag.
</video>
<p style="font-size: 12px; margin: 0;">PikWizard</p>
</a>
</span>
</span>
Free (free of charge)
Free for personal and commercial use.
Author: Awesome Content