
- Home >
- Stock Videos >
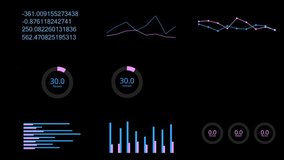
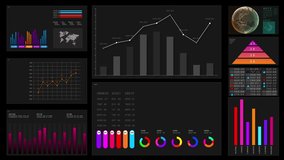
- Futuristic Data Analytics Interface with Charts and Graphs
Futuristic Data Analytics Interface with Charts and Graphs Video

This visualization represents a modern business data analytics interface filled with comprehensive charts, graphs, and a grid network blueprint. Its high-tech design is ideal for using in simulations, analysis software demonstrations, business presentations, technology slides, or educational materials focusing on data science and financial analytics.
Powered by  - Get 15% off with code: PIKWIZARD15


downloads
Tags:
More
Credit Photo
If you would like to credit the Photo, here are some ways you can do so
Text Link
video Link
<span class="text-link">
<span>
<a target="_blank" href=https://pikwizard.com/video/futuristic-data-analytics-interface-with-charts-and-graphs/71d5e4d5a0c69fe60a5bb45c97ab1f3f/>PikWizard</a>
</span>
</span>
<span class="image-link">
<span
style="margin: 0 0 20px 0; display: inline-block; vertical-align: middle; width: 100%;"
>
<a
target="_blank"
href="https://pikwizard.com/video/futuristic-data-analytics-interface-with-charts-and-graphs/71d5e4d5a0c69fe60a5bb45c97ab1f3f/"
style="text-decoration: none; font-size: 10px; margin: 0;"
>
<video controls style="width: 100%; margin: 0;">
<source src="https://player.vimeo.com/progressive_redirect/playback/826421760/rendition/240p/file.mp4?loc=external&oauth2_token_id=1223210874&signature=7e861aaad4f7582c5635151044d85f3089a7a6a0c1b51f93f701c7929f76fe79" type="video/mp4"
poster="https://pikwizard.com/pw/medium/71d5e4d5a0c69fe60a5bb45c97ab1f3f.jpg"/>
Your browser does not support the video tag.
</video>
<p style="font-size: 12px; margin: 0;">PikWizard</p>
</a>
</span>
</span>
Free (free of charge)
Free for personal and commercial use.
Author: Awesome Content